With price consolidating near the value area low (VAL), analysts are now evaluating whether a bottom is forming and whether ASTER is preparing for a potential rotationWith price consolidating near the value area low (VAL), analysts are now evaluating whether a bottom is forming and whether ASTER is preparing for a potential rotation

Aster price holds steady at $0.92 amid volatile market conditions: Bottom taking shape?

2025/12/13 02:30

Aster price remains stable around the $0.92 support zone as buyers defend the value area low, raising the possibility of a bottom forming and a potential rotation toward higher resistance levels.

Summary
  • ASTER maintains stability above the $0.92 support and value area low.
  • Repeated buybacks hint at accumulation and early bottom formation.
  • A reclaim of the Point of Control could trigger a move toward $0.09 HTF resistance.

Aster (ASTER) continues to demonstrate impressive stability amid broader market volatility, holding firmly around the critical $0.92 support region. Despite external market pressure and fluctuating sentiment, ASTER has retained structure and maintained a key high-time-frame (HTF) support zone.

With price consolidating near the value area low (VAL), analysts are now evaluating whether a bottom is forming and whether ASTER is preparing for a potential rotation toward higher resistance levels.

Aster price key technical points

  • Aster trades steadily near the $0.92 support, showing signs of early bottoming behavior.
  • Price sits above the Value Area Low and $0.91 HTF support, signalling buyer interest and demand absorption.
  • Reclaiming the Point of Control (POC) could trigger a rotation toward the $0.09 HTF resistance.
Aster price holds steady at $0.92 amid volatile market conditions: Bottom taking shape? - 1

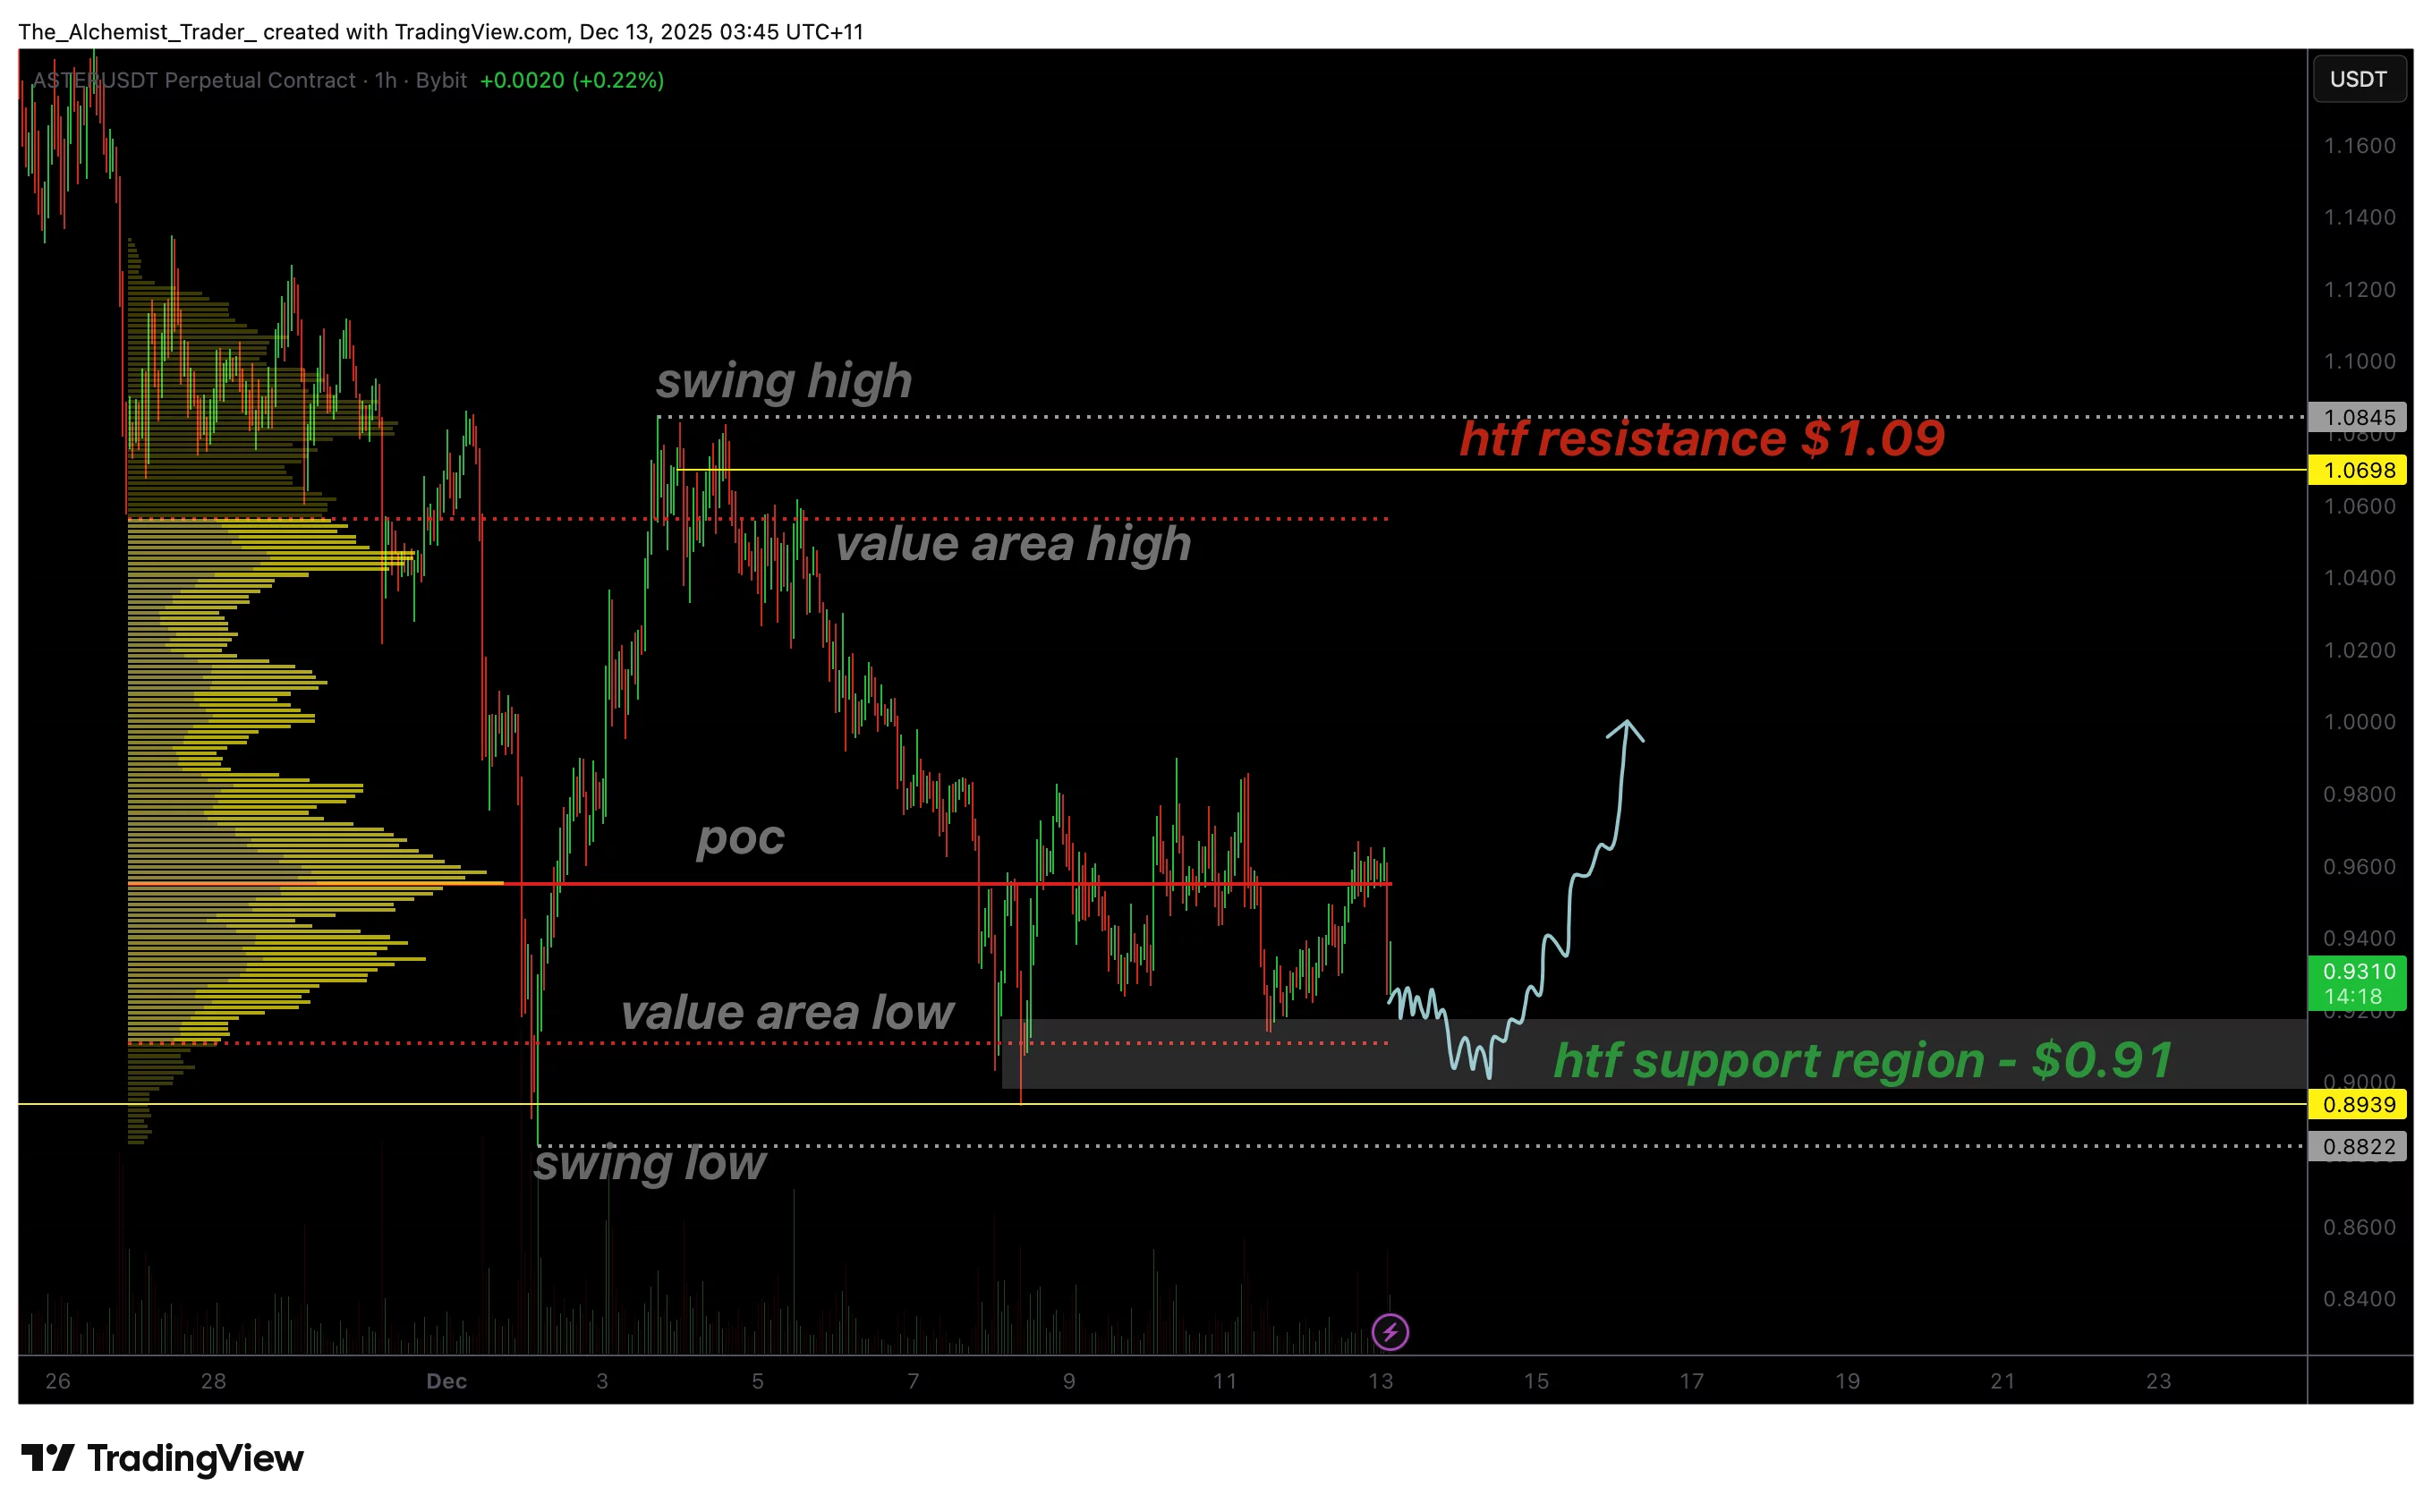
For several consecutive days, ASTER’s price action has remained anchored around the $0.92 HTF support, forming a stable base despite challenging market conditions. This region aligns with the Value Area Low, representing the lower boundary of fair value in the current trading range.

When price repeatedly holds above the VAL, it often signals that an accumulation phase is underway, with buyers consistently absorbing sell-side liquidity, momentum further supported by Aster revealing its 2026 roadmap, including plans for a new layer-1 blockchain, which has strengthened long-term investor confidence.

The behavior around this support strongly resembles a bullish order-block structure, where repeated recoveries reinforce market confidence. Although ASTER has produced occasional wicks below $0.92, the important detail is that daily candle closes continue to hold above the VAL, confirming that demand persists at this level. These buybacks show that market participants remain willing to accumulate ASTER at current prices, supporting the idea of a bottom forming.

As long as ASTER maintains closes above the value area low, the support remains validated. Temporary dips into the level are acceptable, but strength on closing timeframes confirms that sellers are not gaining control. This pattern reinforces the current region as a foundation for potential upside movement.

The next major structural barrier lies at the Point of Control (POC), the area with the highest traded volume in the current range. A reclaim of the POC often marks the transition from consolidation to expansion, as it indicates reestablished balance and growing bullish participation. If ASTER can successfully reclaim the POC, it would significantly increase the likelihood of a rotation toward the HTF resistance at $0.09.

The $0.09 level is one of the most important resistance zones on ASTER’s chart, acting as both a historical rejection area and a structural upper boundary of the current range. A move toward this level would signal not just recovery but momentum expansion, potentially setting the stage for further trend shifts.

From a market structure perspective, ASTER remains constructive. The asset is defending its HTF support, showing resilience, and consistently absorbing liquidity. These are classic signs of early accumulation, with no indications of a breakdown at present. Still, the reclaim of the POC remains the key signal required to confirm bullish continuation.

What to expect in the coming price action

If ASTER maintains support at $0.92 and reclaims the Point of Control, a rotation toward the $0.09 HTF resistance becomes increasingly likely. Losing support, however, would delay bullish continuation and return ASTER to a broader consolidation range.

Disclaimer: The articles reposted on this site are sourced from public platforms and are provided for informational purposes only. They do not necessarily reflect the views of MEXC. All rights remain with the original authors. If you believe any content infringes on third-party rights, please contact [email protected] for removal. MEXC makes no guarantees regarding the accuracy, completeness, or timeliness of the content and is not responsible for any actions taken based on the information provided. The content does not constitute financial, legal, or other professional advice, nor should it be considered a recommendation or endorsement by MEXC.

You May Also Like

Next XRP ‘Monster Leg’ Will Start No Earlier Than 2026: Analyst

Next XRP ‘Monster Leg’ Will Start No Earlier Than 2026: Analyst

An XRP/BTC long-term chart shared by pseudonymous market technician Dr Cat (@DoctorCatX) points to a delayed—but potentially explosive—upswing for XRP versus Bitcoin, with the analyst arguing that “the next monster leg up” cannot begin before early 2026 if key Ichimoku conditions are to be satisfied on the highest time frames. Posting a two-month (2M) XRP/BTC chart with Ichimoku overlays and date markers for September/October, November/December and January/February, Dr Cat framed the setup around the position of the Chikou Span (CS) relative to price candles and the Tenkan-sen. “Based on the 2M chart I expect the next monster leg up to start no earlier than 2026,” he wrote. “Because the logical time for CS to get free above the candles is Jan/Feb 2026 on an open basis and March 2026 on a close basis, respectively.” XRP/BTC Breakout Window Opens Only In 2026 In Ichimoku methodology, the CS—price shifted back 26 periods—clearing above historical candles and the Tenkan-sen (conversion line) is used to confirm the transition from equilibrium to trending conditions. That threshold, in Dr Cat’s view, hinges on XRP/BTC defending roughly 2,442 sats (0.00002442 BTC). “As you see, the price needs to hold 2442 so that CS is both above the candles and Tenkan Sen,” he said. Related Reading: Facts Vs. Hype: Analyst Examines XRP Supply Shock Theory Should that condition be met, the analyst sees the market “logically” targeting the next major resistance band first around ~7,000 sats, with an extended 2026 objective in a 7,000–12,000 sats corridor on the highest time frames. “If that happens, solely looking at the 2M timeframe the logical thing is to attack the next resistance at ~7K,” he wrote, before adding: “Otherwise on highest timeframes everything still looks excellent and points to 7K–12K in 2026, until further notice.” The roadmap is not without nearer-term risks. Dr Cat flagged a developing signal on the weekly Ichimoku cloud: “One more thing to keep an eye on till then: the weekly chart. Which, if doesn’t renew the yearly high by November/December will get a bearish kumo twist. Which still may not be the end of the world but still deserves attention. So one more evaluation is needed at late 2025 I guess.” A bearish kumo twist—when Senkou Span A crosses below Senkou Span B—can foreshadow a medium-term loss of momentum or a period of consolidation before trend resumption. The discussion quickly turned to the real-world impact of the satoshi-denominated targets. When asked what ~7,000 sats might mean in dollar terms, the analyst cautioned that the conversion floats with Bitcoin’s price but offered a rough yardstick for today’s market. “In current BTC prices are roughly $7.8,” he replied. The figure is illustrative rather than predictive: XRP’s USD price at any future XRP/BTC level will depend on BTC’s own USD value at that time. The posted chart—which annotates the likely windows for CS clearance as “Jan/Feb open CS free” and “March close” following interim checkpoints in September/October and November/December—underscores the time-based nature of the call. On multi-month Ichimoku settings, the lagging span has to “work off” past price structure before a clean upside trend confirmation is possible; forcing the move earlier would, in this framework, risk a rejection back into the cloud or beneath the Tenkan-sen. Contextually, XRP/BTC has been basing in a broad range since early 2024 after a multi-year downtrend from the 2021 peak, with intermittent upside probes failing to reclaim the more consequential resistances that sit thousands of sats higher. The 2,442-sats area Dr Cat highlights aligns with the need to keep the lagging span above both contemporaneous price and the conversion line, a condition that tends to reduce whipsaws on very high time frames. Related Reading: Analyst Sounds Major XRP Warning: Last Chance To Get In As Accumulation Balloons Whether the market ultimately delivers the 7,000–12,000 sats advance in 2026 will, by this read, depend on two things: XRP/BTC’s ability to hold above the ~2,442-sats pivot as the calendar turns through early 2026, and the weekly chart avoiding or quickly invalidating a bearish kumo twist if new yearly highs are not set before November/December. “If that happens… the logical thing is to attack the next resistance at ~7K,” Dr Cat concludes, while stressing that the weekly cloud still “deserves attention.” As with any Ichimoku-driven thesis, the emphasis is on alignment across time frames and the interaction of price with the system’s five lines—Tenkan-sen, Kijun-sen, Senkou Spans A and B (the “kumo” cloud), and the Chikou Span. Dr Cat’s thread leans on the lagging span mechanics to explain why an earlier “monster leg” is statistically less likely, and why the second half of 2025 will be a critical checkpoint before any 2026 trend attempt. For now, the takeaway is a timeline rather than an imminent trigger: the analyst’s base case defers any outsized XRP outperformance versus Bitcoin until after the CS clears historical overhead in early 2026, with interim monitoring of the weekly cloud into year-end. As he summed up, “On highest timeframes everything still looks excellent… until further notice.” At press time, XRP traded at $3.119. Featured image created with DALL.E, chart from TradingView.com
Share
NewsBTC2025/09/19 03:00