
SHIB Price History: Analysis, All-Time High & Price Factors
TL;DR
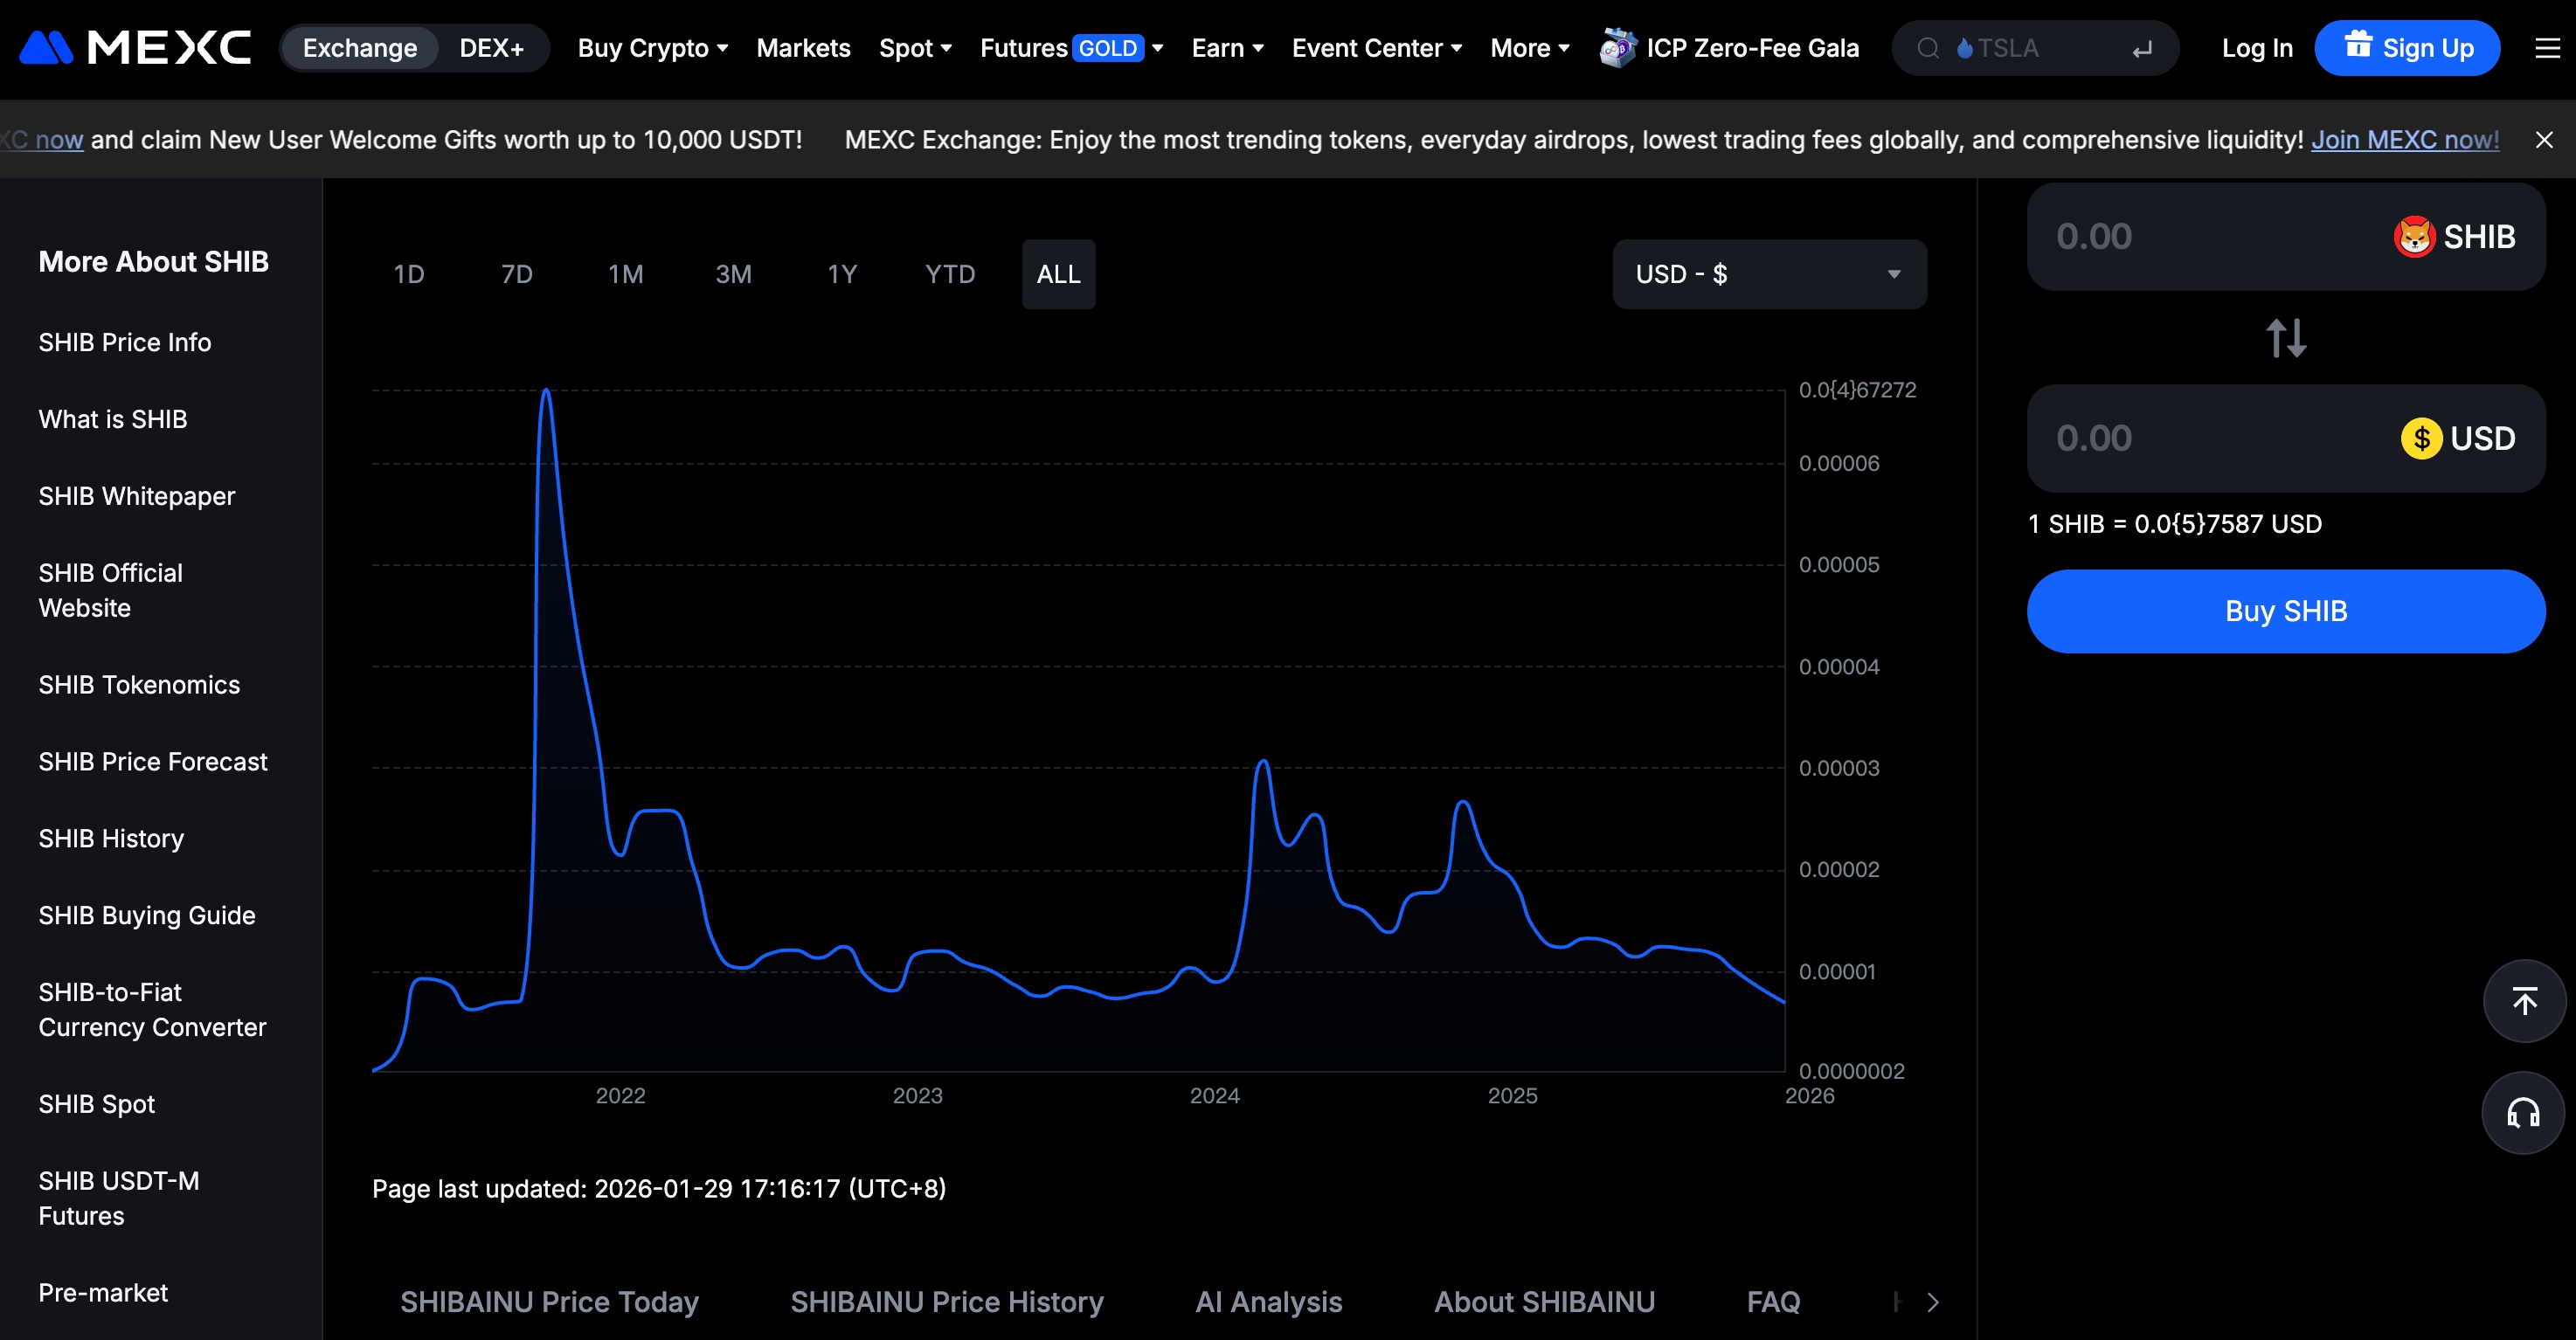
- SHIB Price History Overview: Launched in August 2020 at near-zero; massive 2021 bull run to ATH ~$0.000088 in late October; post-2021 corrections with periodic recoveries tied to ecosystem milestones.
- All-Time High (ATH): ~$0.00008845 on October 27–28, 2021 (some trackers list $0.00008616); represents peak meme frenzy.
- Current Price (Jan 2026): Around $0.0000078–$0.000008, with recent minor fluctuations (e.g., +0.15% in 24h).
- Why is SHIB going up (or down)? Price driven by burns reducing supply, Shibarium utility growth, broader market sentiment (e.g., BTC cycles), community/whale activity, and hype/news. Recent 2026 movements often stem from volume spikes, RSI signals, or ecosystem updates.
- Intermediate Analysis Logic: Combine historical patterns (e.g., bull cycles), on-chain metrics (burns, holders), technical indicators (RSI, support/resistance), and fundamentals (ecosystem progress) for informed views.
Introduction
SHIB Price History – Key Phases
Launch (Aug 2020)
Early Growth (2020–2021)
Peak Bull Run (2021)
- Retail FOMO: Fear of missing out on the “next Dogecoin”.
- Listings on Major Exchanges: Accessibility through major platforms like Binance and Coinbase boosted visibility.
- Celebrity Mentions: Endorsements from figures like Elon Musk played a huge role in driving the hype.
Post-ATH Corrections (2022–2024)
2025–2026 Cycle
SHIB All-Time High (ATH) Explained
What Drove the ATH?
- Massive Retail Influx: The 2021 bull market saw widespread retail adoption of meme coins.
- Listings on Major Exchanges: SHIB was listed on several major exchanges, significantly increasing liquidity and exposure.
- Community Hype: The Shiba Inu community, known as the “SHIB Army”, created a viral presence on social media platforms, driving more attention to the token.
- Broader Altcoin Euphoria: The Dogecoin frenzy spilled over into other meme coins, with SHIB gaining attention as the next big meme coin.
Current SHIB Price (January 2026) & Recent Trends
Key Factors Influencing SHIB Price – Why Is SHIB Going Up?
Intermediate Analysis Tips
- Track On-Chain Data: Monitor burn trackers, holder count, and Shibarium metrics to assess supply changes and ecosystem growth.
- Use Technical Analysis: Look for support around $0.000007 and resistance near $0.00001. Watch for RSI trends (overbought/oversold) and volume surges.
- Monitor News: Stay updated with official Shiba Inu channels for any announcements on burn events, Shibarium updates, or ecosystem developments.
- Risk Management: Be mindful of volatility and market cycles. Use proper position sizing and avoid FOMO (fear of missing out).
Conclusion
Disclaimer
Popular Articles
What is Shibarium? Complete Guide to Shiba Inu's Layer-2 Blockchain
What is Shibarium? Complete Layer-2 Guide for SHIBShibarium is a Layer-2 blockchain solution built on Ethereum, designed to reduce gas fees and increase transaction speeds. By offloading transactions

How to Stake SHIB on ShibaSwap: Complete Bury & Dig Tutorial (Earn Rewards)
ShibaSwap is the decentralized exchange (DEX) for the Shiba Inu ecosystem, allowing users to swap tokens, provide liquidity (Dig), and stake assets (Bury) to earn rewards like BONE. Burying SHIB, LEAS
What is SHIB: The Metaverse? Complete Guide to Shiba Inu's Virtual Land
SHIB: The Metaverse is a virtual universe created by the Shiba Inu ecosystem, aiming to integrate Shiba Inu (SHIB) tokens, LEASH, BONE, and other assets in a decentralized environment. Built on Shibar
What are BONE & LEASH Tokens? A Complete Shiba Inu Ecosystem Guide
BONE (Bone ShibaSwap) is the governance and utility token for ShibaSwap, enabling voting on proposals, staking rewards, and ecosystem participation. LEASH (Doge Killer) is a scarcer token in the Shiba
Hot Crypto Updates
View More
What is 黑马 (黑马)? An Introduction to Cryptocurrency and Emerging Meme Token Innovation
What Exactly is 黑马 (黑马)? 黑马 (黑马) is a blockchain-based cryptocurrency and digital asset that powers the decentralized platform focused on solving specific industry challenges in DeFi and meme coin

What is BSC不需要脑子 (傻福) SHAOFU? An Introduction to Cryptocurrency
What Exactly is BSC不需要脑子 (傻福) SHAOFU? BSC不需要脑子 (傻福) SHAOFU is a blockchain-based cryptocurrency that powers the decentralized meme token ecosystem focused on community-driven entertainment and viral

What is Clippy CLIPPY? An Introduction to Cryptocurrency
What Exactly is Clippy CLIPPY? Clippy (CLIPPY) is a blockchain-based meme coin that powers a decentralized community inspired by Microsoft's iconic assistant Clippy, encouraging users to change their

What is 2131KOBUSHIDE (21)? An Introduction to Cryptocurrency
What Exactly is 2131KOBUSHIDE (21)? 2131KOBUSHIDE (21) is a Solana-based meme token that powers the pump.fun ecosystem focused on fair-launch meme coin creation. Launched in recent months via
Trending News
View More
Shiba Inu Price Prediction: SHIB’s Mysterious Leader Hasn’t Said a Word in 21 Days – Is Something Big Coming?
Shiba Inu’s lead developer, Shytoshi Kusama, has gone quiet for over 21 days on X, sparking growing speculation across the community.Many believe this unexpected
Shiba Inu (SHIB) Daily Market Analysis
## Shiba Inu (SHIB) Recent Developments ### Market Performance and Price Action The live Shiba Inu price today is $0.000008047 USD with a 24-hour trading volume

Shiba Inu Price Prediction 2026-2030: The Realistic Path to $0.000330
BitcoinWorld Shiba Inu Price Prediction 2026-2030: The Realistic Path to $0.000330 Global cryptocurrency markets continue evolving in 2025, with Shiba Inu (SHIB

Can Shiba Inu price hold firm as memecoins and alts begin the long road to recovery?
The post Can Shiba Inu price hold firm as memecoins and alts begin the long road to recovery? appeared on BitcoinEthereumNews.com. Disclosure: This article does
Related Articles
What is Shibarium? Complete Guide to Shiba Inu's Layer-2 Blockchain
What is Shibarium? Complete Layer-2 Guide for SHIBShibarium is a Layer-2 blockchain solution built on Ethereum, designed to reduce gas fees and increase transaction speeds. By offloading transactions
How to Stake SHIB on ShibaSwap: Complete Bury & Dig Tutorial (Earn Rewards)
ShibaSwap is the decentralized exchange (DEX) for the Shiba Inu ecosystem, allowing users to swap tokens, provide liquidity (Dig), and stake assets (Bury) to earn rewards like BONE. Burying SHIB, LEAS
What is SHIB: The Metaverse? Complete Guide to Shiba Inu's Virtual Land
SHIB: The Metaverse is a virtual universe created by the Shiba Inu ecosystem, aiming to integrate Shiba Inu (SHIB) tokens, LEASH, BONE, and other assets in a decentralized environment. Built on Shibar
What are BONE & LEASH Tokens? A Complete Shiba Inu Ecosystem Guide
BONE (Bone ShibaSwap) is the governance and utility token for ShibaSwap, enabling voting on proposals, staking rewards, and ecosystem participation. LEASH (Doge Killer) is a scarcer token in the Shiba
