

Crude Oil Futures Chart: How to Read the Energy Market
If you want to trade global energy, the crude oil futures chart is your most important tool. It is not just a picture of past prices. It is a live map of human psychology, supply, and demand.
Many beginners look at a trading chart and feel confused by the green and red bars. In this guide, I will explain exactly how to read a crude oil futures chart. I will also show you how to spot macro trends and execute trades using MEXC.
The Anatomy of a Candlestick
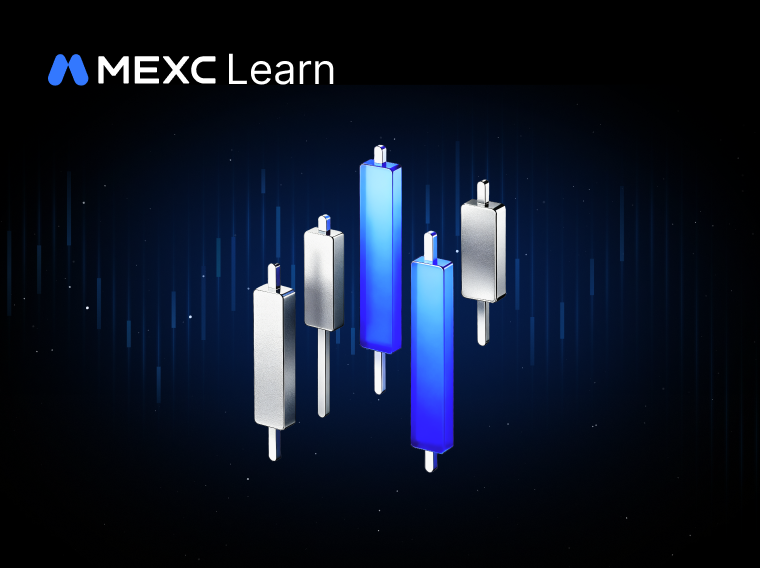
Most professional traders use a "candlestick" chart (or K-line chart) to track oil prices. Each candlestick shows you the price action for a specific time period, like one hour or one day.
Every single candlestick gives you four critical pieces of data, known as OHLC:
Open: The price when the time period started.
High: The highest price reached during that time.
Low: The lowest price dropped to during that time.
Close: The final price when the time period ended.
If the Close is higher than the Open, the candlestick is green (Bullish). Buyers won the battle. If the Close is lower than the Open, the candlestick is red (Bearish). Sellers pushed the price down.
WTI vs. Brent on the Chart
When you open an exchange, you will see different charts for different types of oil. You must choose the right chart for your strategy.
If you are trading US economic data, you should open the WTI chart. If you are trading Middle East news, you should open the Brent chart. To understand why these two charts move slightly differently during a crisis, read our guide on the difference between WTI and Brent.
Interactive Chart Reading Simulator
The best way to understand a crude oil futures chart is to interact with one. Use the educational simulator below to see how candlesticks form. You can trigger different macro events to see how the chart reacts in real time.
Hover over the candles to read the exact Open, High, Low, and Close data.
Why 24/7 Chart Access Matters
Traditional commodity markets close on Friday evening. They do not open again until Monday morning. This creates a massive problem.
If a war starts on Saturday, the oil price will gap up massively. Traditional traders cannot see this on their charts or protect their money until Monday. By then, it is too late.
This is why modern traders use synthetic derivatives. If you want to know how this works behind the scenes, read what are crypto crude oil futures. Because crypto exchanges never sleep, your WTI and Brent charts update 24 hours a day, 7 days a week. You can see the price action the exact second a news story breaks.
Execute Your Strategy on MEXC
Once you know how to read the chart, it is time to trade. If you are ready to learn how to trade crude oil with USDT, MEXC provides the ultimate platform.
Here is why you should trade oil on MEXC:
0% Trading Fees: Every time a candlestick closes, you can enter or exit a trade without paying high broker commissions.
200x Leverage: You can use a small amount of capital to catch big profits from minor chart breakouts.
Deep Liquidity: MEXC offers institutional-grade order books. This means your market orders execute instantly, exactly where you see the price on the chart.
Do not trade blindly. Learn the chart, manage your risk, and trade the global energy market with confidence. Log in to MEXC, open the USOIL or UKOIL chart, and start catching the next big macro trend today.
人気記事
もっと見る
MEXC 暗号資産マクロ&取引週次レポート:FOMCは現状維持、ビットコインは80,000ドルの節目を維持できるか?
決済期間: 2026年10月21日~2026年10月28日 リリース日: 2026年10月29日 データソース: MEXC プラットフォームデータ、Farside Investors、CoinGlass、CoinDesk、Reuters、CNBCTL;DRマクロ見通し: FRSは10月28日に金利を3.75%~4.00%に据え置いたが、2人のメンバーが利上げに投票した。12月の利上げ確率は78%か

EIP-7702とは?イーサリアムのスマートアカウント機能の仕組みと安全対策を解説
2026年10月29日、バイナンス(Binance)が管理するイーサリアムのホットウォレットが、わずか1件のトランザクションで空になりました。 資金の抜き取りに使われたのは、2025年5月にイーサリアムで実装された機能「EIP-7702」です。 2026年10月30日時点で、EIP-7702そのものの欠陥は報告されていません。 EIP-7702は有効な署名の指示どおりに動いただけであり、そこにこそ
Apple決算日:Appleはいつ決算を発表するのか?時間、結果の履歴、株価の反応
Appleは2026年度第4四半期(2026年7月〜9月)の決算を、2026年11月2日月曜日の米国市場終了後に発表します。 決算説明会は東部時間午後5時(太平洋時間午後2時)、すなわち北京時間11月3日火曜日午前6時に開始されます。これはJohn Ternus氏がAppleのCEOとして初めて迎える決算説明会となります。Appleは10月上旬にこの日程を確認しました。9to5Macが報じています



MEXCコミュニティに参加する
公式Telegramチャネルから、最新の上場情報・イベント・アップデートをリアルタイムで受け取れます。



