On September 3rd, the three major US stock indexes collectively rose. The S & P 500 closed at 7,748.27 points, up 1.07%, the Nasdaq rose 1.40%, and the Dow Jones rose 1.18%. The push came from the bond market: the yield of 10-year US Treasury bonds fell by about 5 basis points to 4.75%. The star of the day was Strategy (MSTR), which rose 17.56% in a single day to close at $144.82 - while Bitcoin only rose 5.5% on the same day.Today, the US Stock Academy turned back time to February 2022 to see how a financial report with revenue still rising by 20% caused the stock price to fall by 26.4% in one day. Tonight at 12:30 UTC, the pre-market report for August's non-farm payrolls is released. The data in this article is based on the closing of the US stock market on September 3rd.
1.September 3rd closing: It's not profit that's rising, it's the discount rate
The unit is points and percentages, and the rise and fall of the day is relative to the closing of the previous trading day. The three major indexes collectively rose on September 3rd, with the Nasdaq leading with a 1.40% increase, the Dow Jones Industrial Average up 1.18%, and the S & P 500 up 1.07% to close at 7,748.27 points. What drove them was specific: the 10-year US Treasury yield fell about 5 basis points to 4.75% on the same day, due to a Federal Reserve Board member's statement of willingness to stand still.
It is worth remembering that the index is not rising in profits, but in discount rates. Corporate profits do not improve within a day, but rather the ratio at which the market discounts future cash flows. When the discount rate is relaxed, assets with lower cash flows rebound faster - which is why Bitcoin, gold, and a Bitcoin vault stock will move together on the same day.
On the same day, there was a reverse example. Broadcom (AVGO) announced its third fiscal quarter after the market closed on September 2nd, with AI-related revenue of about $16.70 billion, a year-on-year increase of about 221%, slightly better than market expectations. However, on September 3rd, the underlying stock still fell by 2.74% to $357.16 - a redemption of good news: good news was already bought into the price before it was announced, and the moment it was announced became a reason to sell.On the other hand, Snowflake (SNOW) rose 16.55% to $356.47, relying on its second quarter results; NVIDIA (NVDA) confirmed the acquisition of Hugging Face for about $12.90 billion.
2.Today's Star MSTR: Bitcoin rises 5.5%, it rises 17.56%
The unit is 0-100 points. Compared with peers and its own one-year history, the benchmark is the closing price on September 3rd. Strategy (MSTR) closed at $144.82 that day, up 17.56%. Its market value increased by about $7.20 billion a day, with a turnover of 44.8 million shares, 2.1 times the daily average. It ranks first among 11 peers in the application software industry, with a full score of 100 in both industry ranking and relative strength, and an industry valuation temperature of 98.
What really needs to be looked at are the other two corners: 0 points for volatility control, which is the weakest corner among the five dimensions; the trend position is only 22 points, and the price is still at the lower edge of its 52-week range. The volatility control that rose the most on the day scored 0 points, which is not a scoring error - a stock that bets the Balance Sheet on a single asset, volatility is normal. The trend position of 22 points to another thing: the increase is today's matter, and the position is a matter of the past year. Just looking at + 17.56%, one would think this is a strong stock.With the addition of trend position 22, we realized that this is a high-volatility stock rebounding from a low position. The two descriptions point to completely different risks.
The same industry code, four rises and two falls
The unit is%, which represents the daily increase and decrease on September 3rd. The benchmark is the closing price of the previous trading day. All six companies are classified as application software, but on the same trading day, there were four increases and two decreases: MSTR rose 17.56%, Snowflake rose 16.55%, Workday rose 3.01%, Datadog rose 2.64%, Kaideng Electronics fell 0.59%, and Autodesk fell 1.74%.
The gains of the top two are similar, but the reasons are unrelated: MSTR rose for Bitcoin, while Snowflake rose for its second quarter performance. Being classified into the same industry code does not mean being priced for the same thing - industry classification refers to what a company sells, not what drives its stock price. The industry average for the day was only -0.32%, while the top tier rose by 17.56%. Only looking at the sector average will completely miss this day.
3.How to calculate magnification and why it varies every day
The unit is%, which is the daily increase of Bitcoin and MSTR, as well as the daily magnification obtained by dividing the two. The algorithm is simple: the stock price increase is divided by the asset increase it tracks. On September 3rd, Bitcoin rose 5.5% and MSTR rose 17.56%. 17.56 ÷ 5.5 is approximately 3.2 times.
The multiple is not a fixed property, it will change with the amount of currency held, debt structure, and stock price premium. The company holds 845,050 bitcoins in its account, which is the molecular end; but the stock price also contains the premium that the market is willing to give and the company's debt cost, which changes every day. Therefore, "3.2 times" is the reading on September 3rd, not a coefficient that can be used to predict tomorrow.
Another easily confused number is Beta. The Beta of MSTR is 3.56, which means the market moves by 1% and it moves by an average of 3.6%. 3.2 is very close to 3.56, but the denominators are completely different: the magnification ratio is Bitcoin, while Beta compares the market. The similarity between the two is just a coincidence and cannot be mutually confirmed.
Another detail: The company restarted buying 4,603 coins at the end of August, about $370 million, the first time after a two-month hiatus. The same Fed conversation also pushed another asset, supporting actor Agnico Eagle (AEM), up 5.32% that day, pushing gold to $4,487 per ounce. Bitcoin and gold follow the same logic: when interest rate expectations cool down, non-interest-bearing assets are relatively popular, with the only difference being elasticity.
4.US Stock Learning: In February 2022, the financial report with revenue still rising by 20%
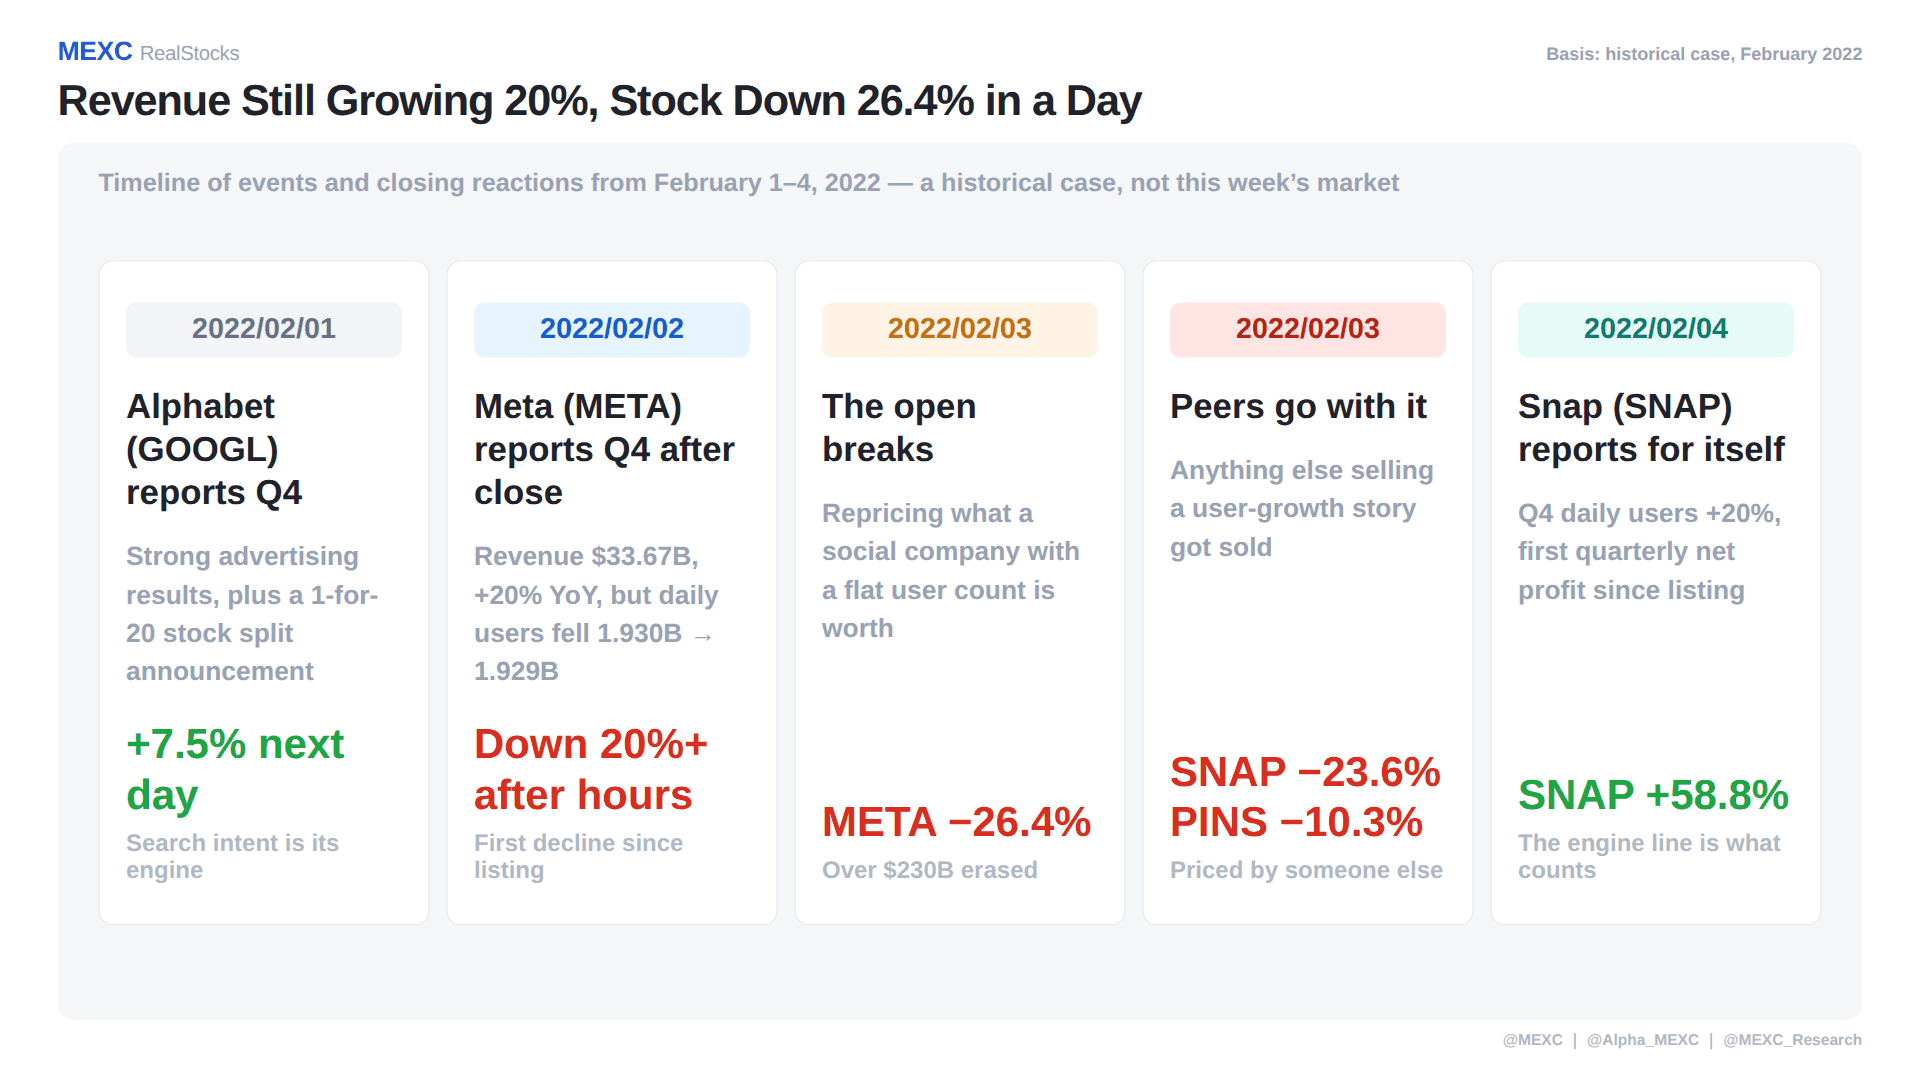
The following is a historical case in February 2022, not this week's market. The order of that week is: On February 1st, Google (GOOGL) released its Q4 financial report, with strong advertising and a plan to split the stock by 1 to 20, closing up 7.5% the next day. On February 2nd, after the market closed, Meta (META) released its Q4 financial report, with revenue of $33.67 billion, a year-on-year increase of 20%, but DAU dropped from 1.93 billion to 1.929 billion, and fell more than 20% after the market closed.On February 3rd, the market collapsed, with META falling 26.4% and its market value evaporating more than 230 billion US dollars, setting a single-day record for the US stock market at that time. Snap (SNAP), which also relies on user growth to tell stories, fell 23.6%, and Pinterest (PINS) fell 10.3%. On February 4th, Snap submitted its own report: DAU increased by 20% year-on-year in the fourth quarter, and net profit turned positive for the first time since its listing, closing up 58.8% that day.
It's not the revenue line that kills the valuation. Revenue is still up 20% year-on-year, and the reason for the decline is that DAU has decreased by about 1 million people, which is the first time since the company went public. In addition, the revenue guidance for the next quarter is only 3% to 11% year-on-year. The market is re-evaluating "how much is a social company with no more users worth", not "how much did the company make last quarter".
The same advertising business, with different growth engines, can have very different pricing. Google relies on search intent, and as long as users are still searching, advertising space is still being sold. Meta relies on the length of time users stay in the information flow. Once the number of users stops, the denominator of the story stops. Snap relies on whether young users are still growing, so it is priced by others' financial reports first and then by its own pricing the next day. In the same week, Google rose 7.5% and Meta fell 26.4%, a difference of 34 percentage points.
On the same day, the decline of five advertising stocks was 8 times
The unit is%, and the value is the Closing Price on February 3, 2022 divided by the Closing Price of the previous trading day minus 1. The order of that day is: Google fell 3.3%, Amazon (AMZN) fell 7.8%, Pinterest fell 10.3%, Snap fell 23.6%, Meta fell 26.4%. The revenue of the five companies is related to advertising, but the decline on the same trading day is 8 times different.
The order of decline is not based on the size of advertising revenue, but on "how much the growth story depends on the number of users continuing to increase". Amazon also sells advertising and has a considerable scale, but advertising is not its growth engine. It only fell 7.8% that day; Google's advertising scale is the largest, but it fell the least because the denominator of search ads is not the number of users.
The best control group in this case is Snap. It defines itself as a camera company rather than a social software company: Snapchat opens with a camera, and almost all of its revenue comes from advertising. Its feature is AR advertising that turns the camera itself into advertising space. It was founded in 2010 and has its headquarters in Santa Monica, California.On February 3rd, it was dragged down by other people's financial reports by 23.6%. That night, it submitted its own report - Q4 revenue 1.298 billion USD (+ 42%), DAU 319 million (+ 20%), and the first single-quarter net profit turned positive since listing - rising 58.8% the next day. Other people's financial reports only give a temporary price, and their own engine only counts.
The transferable reading is three steps: first look at the growth engine line, not the revenue line (Meta is the number of users and dwell time, Google is the number of searches, those who sell equipment are the shipment volume, and revenue is only the result); then look at the guidance, not the past season, because the market buys the future; finally, look at where the money will be spent. If the same financial report raises the capital expenditure guidance, it is equivalent to telling you that profits will be suppressed for several more years.
5.What to watch tonight: August non-farm payrolls report
The unit is a thousand people, which is the month-on-month increase in non-farm employment (seasonally adjusted). The first three are published values, and the last one is market expectations. The August non-farm employment report was released before 12:30 UTC and landed one hour before the opening. This week's macro focus is all on this data. The next stop is the Federal Open Market Committee's interest rate decision on September 16th - tonight is the last employment data before the meeting. The current policy position is between 3.50% and 3.75%, and it has remained unchanged for five consecutive meetings.
Tonight's reaction function is reversed. After the chairperson emphasized inflation in Jackson Hole, the market's pricing of the September 16th meeting has shifted from interest rate cuts to interest rate hikes. Employment data is the only input item that has not been revealed yet. Therefore, the stronger the data, the more hawkish it is, and the weaker it is, the more it eases the pressure of interest rate hikes, which is exactly opposite to the intuition that "good news is good news".
Why not just focus on tonight's number: 103,000 people have been revised down in the past two months, and the signal to noise ratio of the monthly reading is very low. The revised May is 63,000, the revised June is 20,000, and July is negative 23,000. The three-month average is only about 20,000 people left; the monthly average of the past 12 months is only 34,000 people - employment growth has long fallen to the level of "tens of thousands of people per month". The market expectation for August is 50,000 people, and where this falls tonight determines whether this moving average is pulled back or pressed lower.
6.Which line is holding up employment in July?
The unit is a thousand people, which is the month-on-month change (seasonally adjusted) in the number of employed people in various industries in July. The net increase is positive and the net decrease is negative. Only four major industries are listed on the chart, which is not equal to the total number of the month. Breaking down the changes in July by industry: only healthcare added people and increased 22,000; financial activities decreased 14,000, retail trade decreased 19,000, and local government education decreased 50,000. These three lines together deducted more than 80,000 jobs to push the total into a negative value.
What really needs to be remembered is this comparison: over the past 12 months, the health care line has added 36,000 people each month, while the entire non-farm payroll month has only 34,000 people - the contribution of one line exceeds all, meaning that if you remove health care, the employment growth in the US is basically zero. This determines how this data should be read: the Toutiao number is the net value of all industries added together, and this net value is currently almost entirely supported by a single industry.
So when the data comes out tonight, the first step is not to look at the Toutiao number, but to turn to the industry sub-item to see if the healthcare line is still there; the second step is to look at the three-month average together, because the two downgrades add up to 103,000 people, and the monthly reading is easy to mislead; the third step is to look at the average hourly wage year-on-year, the previous value is 3.2%, and the expected 3.0%. This column is directly linked to inflation and is the variable that this meeting really cares about.
7.FAQs
Q1: MSTR increased by 17.56% in one day, why is the "trend position" in the 5D score only 22 points?
Because the two quantities are not the same thing. The daily increase is compared to today's performance, while the trend position is compared to the position of the price within its own 52-week range. A stock can rise the most on a certain day, while the price remains at the lower edge of its own range. The same principle applies when the industry ranking is out of 100, but the volatility control score is 0.
Q2: Are magnification 3.2 and Beta 3.56 the same thing?
No, the denominators of the two are different. The magnification factor is the daily stock price increase divided by the asset increase it tracks. On September 3rd, it was 17.56 ÷ 5.5 is approximately 3.2 times, and the denominator is Bitcoin. Beta measures the average fluctuation of the stock price relative to the market, and the denominator is the market. The closeness of the two numbers is purely coincidental. The magnification factor also changes daily with the amount of currency held, debt, and stock price premium, and is not a fixed coefficient.
Why do two stocks in the same industry have similar gains on the same day but have no relationship?
Because industry classification talks about what a company sells, not what drives its stock price. On September 3rd, MSTR rose 17.56% and Snowflake rose 16.55%. The former followed Bitcoin, and the latter followed its own financial report. On the same day, the industry average was only -0.32%, with four out of six rising and two falling - looking at the sector average will conceal this internal gap.
Q4: Meta's revenue is still increasing by 20% in 2022, why did the stock price fall by 26.4% in one day?
Because the market is not pricing the revenue line. In that financial report, DAU dropped from 1.93 billion to 1.929 billion, the first decline since listing. At the same time, the revenue guidance for the next quarter is only 3% to 11% year-on-year. Revenue is the result of the past quarter, and the number of users and guidance are the input items for the future. In the same week, Google's advertising financial report increased by 7.5% because the growth of search ads does not require the number of users to continue to increase.
Q5: Which column should we look at first for tonight's non-farm payroll data?
First look at the healthcare industry sub-item, then look at the three-month average, and finally look at the average hourly wage year-on-year. In the past 12 months, the healthcare line has added 36,000 people per month, and the entire non-farm month has only 34,000 people. The Toutiao number is almost entirely supported by this line. The two downward revisions add up to 103,000 people, indicating that the monthly reading noise is very loud. The average hourly wage (previous value 3.2%, expected 3.0%) is directly linked to inflation.
Disclaimer: This article is compiled and written by the MEXC RealStocks team. The data in this article is based on the closing of the US stock market on September 3, 2026. The content is compiled from public market information, and the individual stocks are publicly discussed targets, which do not represent the recommendation or opinion of MEXC and do not constitute any investment advice. More US stock content: @MEXC | @Alpha_MEXC | @MEXC_Research