

Bitcoin Drops Again, Slipping Back Toward $74,000
After several sessions of shallow consolidation, Bitcoin rolled over again and drifted back into a zone that has already absorbed multiple downside tests over the past week.
That repetition matters. It suggests the market is no longer reacting emotionally, but mechanically probing whether long-term support can continue to absorb supply.
At the time of observation, Bitcoin is trading near $74,100, sitting just above a historically reactive support area.
Short-Term Price Action: Renewed Pressure Into the $73,000–$75,000 Zone
On the chart, price has completed another leg lower following a failed stabilization attempt above $78,000–$79,000. The decline unfolded in steps rather than a single impulse, indicating controlled selling rather than panic-driven liquidation.
The most recent drop pushed Bitcoin back toward $74,000, where price has repeatedly slowed over recent sessions. Volume expanded during downside pushes but failed to produce sustained follow-through, suggesting selling pressure is being absorbed rather than aggressively extended.
Immediate support is defined in the $73,000–$74,000 range. This zone has now been tested multiple times, increasing its importance as a structural reference. A clean hold keeps price within a broader basing process.
On the upside, short-term resistance sits near $76,500–$78,000, where prior rebounds have consistently stalled. Until price can reclaim and accept above that area, recovery attempts remain corrective.
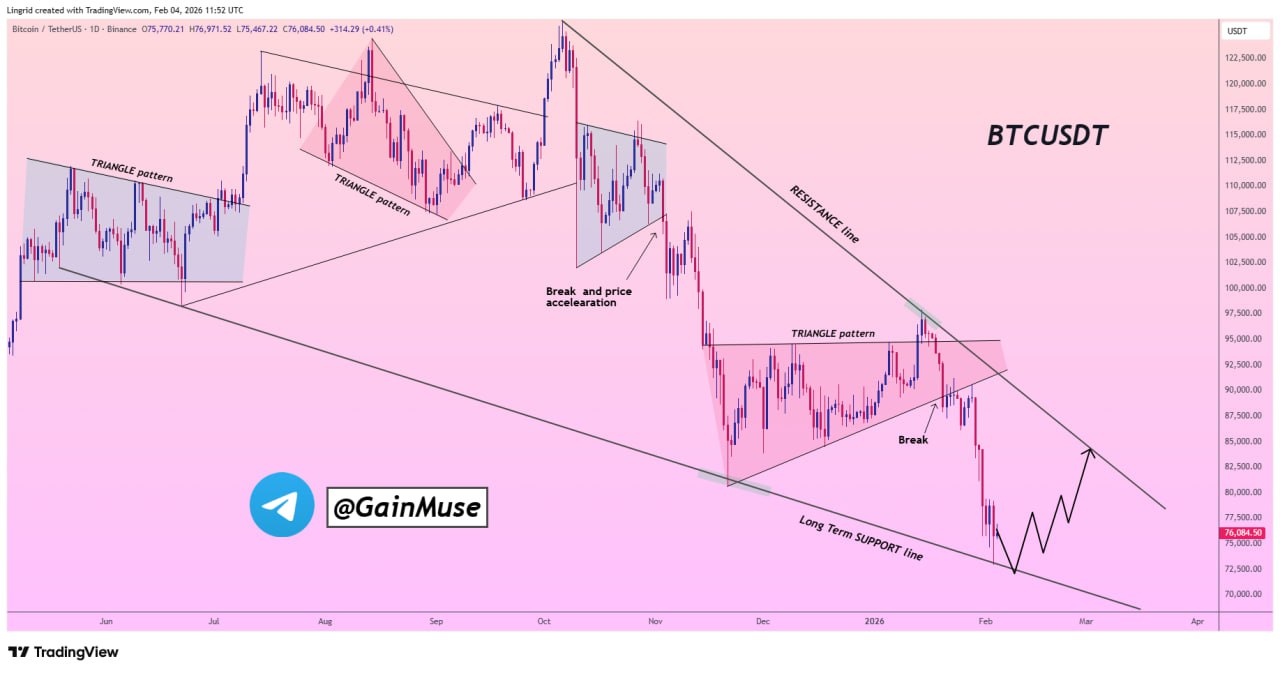
Higher-Timeframe Structure: Long-Term Support Under Active Test
The broader structure, highlighted in the annotated chart by GainMuse, places Bitcoin within a declining channel following a multi-leg corrective phase. Several triangle formations resolved lower before price accelerated into the current support region.
 Source: https://t.me/gainmuse/1760
Notably, the latest breakdown lacked continuation. Instead of expanding lower, price transitioned into compression along the long-term ascending support line, a level that has historically produced reactive behavior rather than immediate failure.
This alignment shows short-term weakness occurring directly into a higher-timeframe demand area. While the dominant trend remains corrective, the absence of downside acceleration suggests selling pressure is no longer increasing at the same rate.
Price remains capped beneath descending resistance, meaning the structure has not shifted bullish. However, the market is now operating inside a zone where direction depends on confirmation rather than momentum alone.
Scenarios and Risk: Stabilization Versus Structural Failure
On the constructive side, holding above $73,000 allows Bitcoin to continue forming a base along long-term support. Sustained stabilization here would increase the probability of a rebound toward the descending resistance zone near $78,000–$80,000, though acceptance above that area would be required to alter structure.
Risk remains clearly defined. A decisive break below $73,000 would invalidate the current basing attempt and reopen downside continuation toward lower support levels visible on the higher-timeframe chart.
This is not a breakout environment. It is a test of whether long-term support can continue to absorb repeated selling waves.
Market Takeaway
Bitcoin has slipped back toward $74,000, but the character of the move is as important as the level itself. Selling pressure has slowed rather than accelerated, even as price revisits a critical support zone.
For now, structure favors patience over prediction. As long as support holds, stabilization remains possible. Failure to defend it, however, would quickly shift the balance back toward continuation. The market is pressing on structure, and confirmation will determine what comes next.
The post Bitcoin Drops Again, Slipping Back Toward $74,000 appeared first on ETHNews.


Ayrıca Şunları da Beğenebilirsiniz

Trump gives Iran 10 days to negotiate or face Strait of Hormuz reopening

Fed Governor Calls For Strong Stablecoin Oversight As CLARITY Act’s Final Text Gets Delayed


