

Will Bitcoin Price Reclaim $100,000 in January? 3 Charts Hold the Answer
Bitcoin started 2026 stuck near $88,000, extending weeks of sideways trading. While price action looks stagnant, on-chain data suggests the market may be quietly shifting beneath the surface.
Three indicators from CryptoQuant point to easing sell pressure, even as macro uncertainty continues to cap upside momentum.
Long-Term Holders Show Signs of Accumulation
Bitcoin’s price has struggled to reclaim key resistance after a sharp pullback in late 2025. The lack of follow-through buying has kept sentiment fragile, with traders waiting for confirmation that the correction has run its course.
The first signal comes from long-term holder (LTH) supply data. After months of negative readings, the 30-day net change in LTH supply has turned positive by roughly 10,700 BTC.
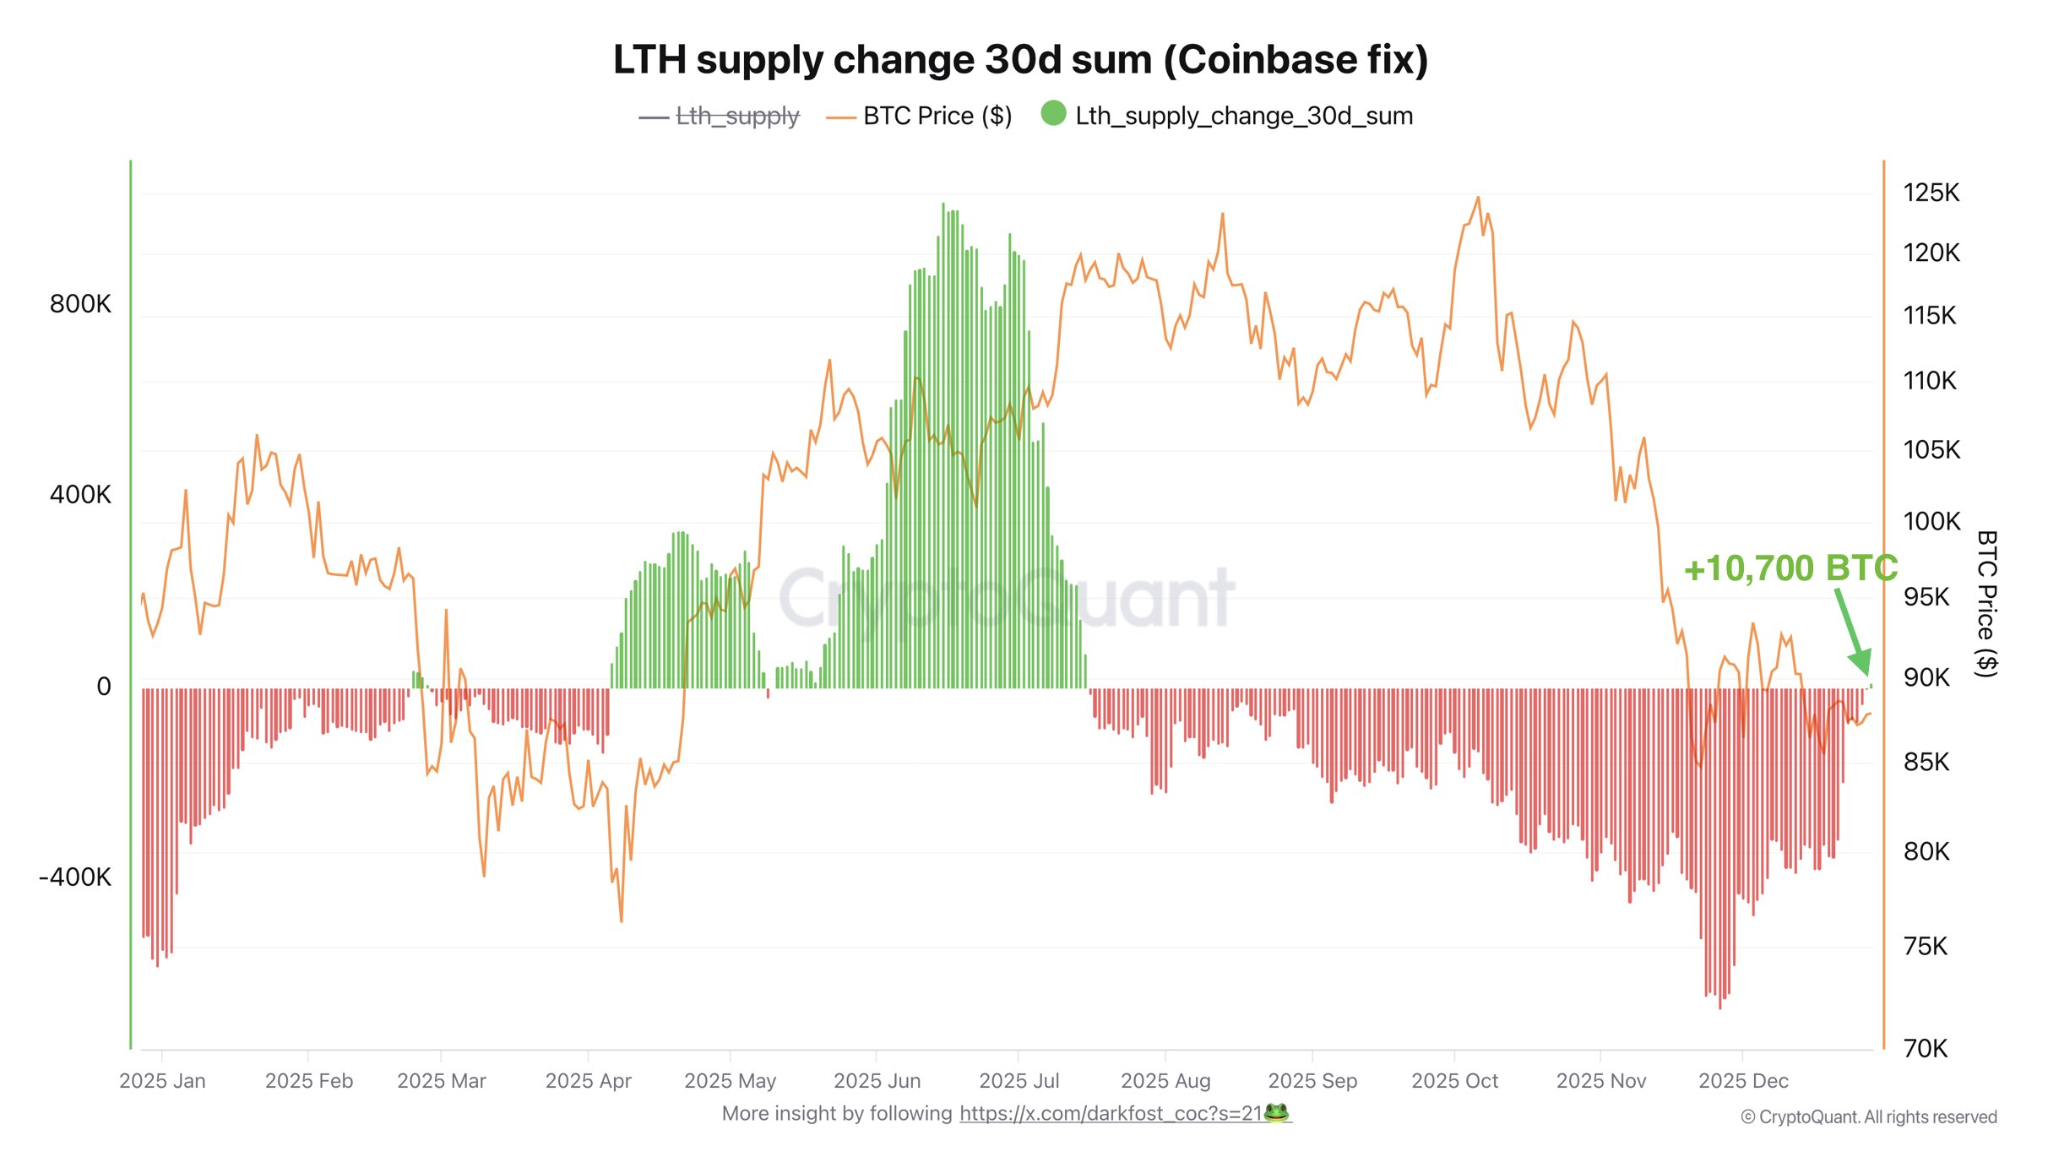 Bitcoin Long-Term Holder’s Supply. Source: X/Darkfost
This shift suggests that long-term investors are no longer distributing coins at scale.
Instead, supply is gradually moving back into stronger hands, a pattern often seen during consolidation phases rather than market tops.
LTH SOPR Signals Balance, not Capitulation
A second chart tracks the long-term holder spent output profit ratio (SOPR). This metric shows whether long-term holders are selling at a profit or a loss.
Currently, LTH SOPR is hovering around the neutral 1.0 level. That indicates long-term holders are not capitulating or rushing to exit at losses.
Historically, this behavior aligns with markets finding equilibrium after a correction, rather than entering a deeper breakdown.
Exchange outflows reduce immediate sell pressure
The third indicator looks at Bitcoin exchange netflows. Recent data shows continued net outflows, with more BTC leaving exchanges than entering them.
This trend reduces immediate sell-side supply on spot markets.
However, the lack of a price rebound suggests demand remains cautious, likely constrained by tighter liquidity and delayed expectations for US rate cuts.
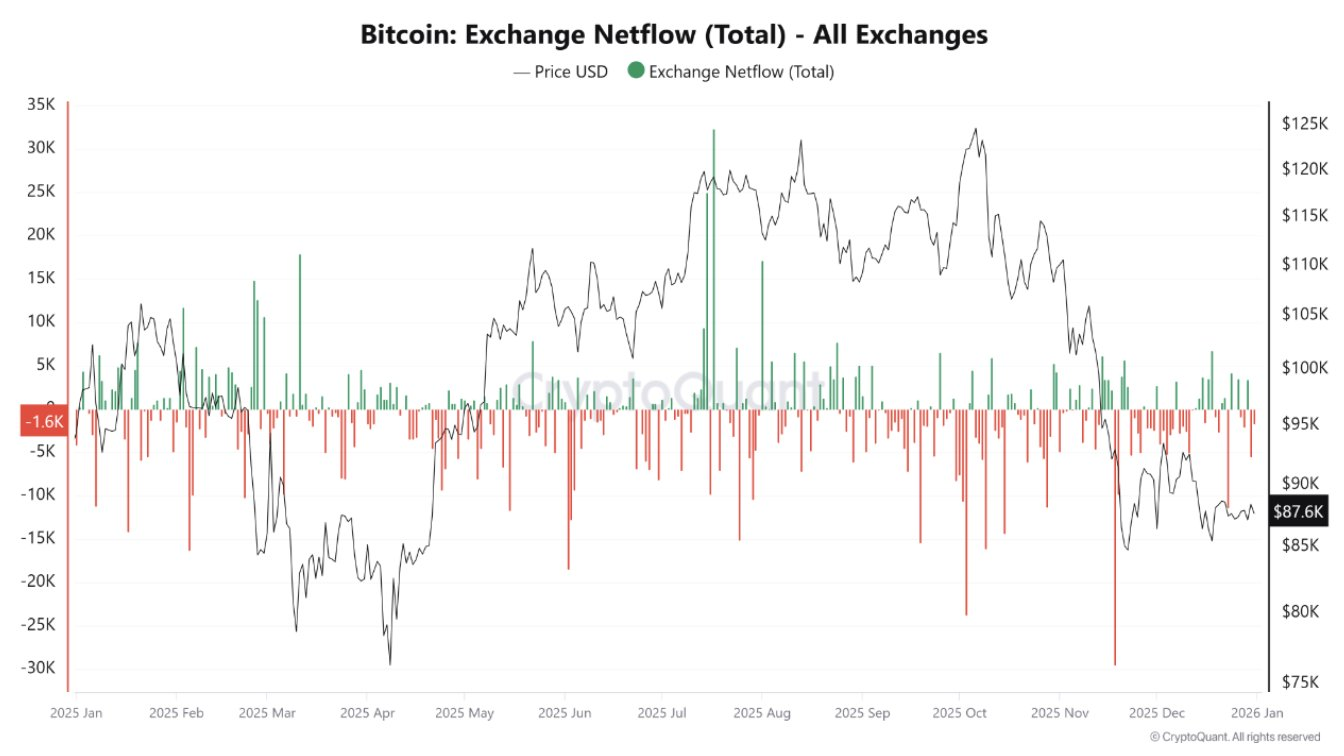 Bitcoin Exchange Netflow. Source: X/CryptoQuant
Will Bitcoin Price Recover in January?
Taken together, the charts paint a mixed but improving picture. Supply-side pressure appears to be easing, and long-term holders remain confident.
Still, price remains range-bound due to weak demand and macro headwinds. A rapid move to $100,000 in January would likely require a fresh catalyst.
Without it, Bitcoin may continue consolidating, building a base that could support a stronger recovery later in 2026 rather than an immediate breakout.
Ayrıca Şunları da Beğenebilirsiniz

Bitcoin Liquidations Surge: Short Positions Dominate $19M in a Stunning 24-Hour Squeeze

Unleashing A New Era Of Seller Empowerment
