

Solana (SOL) Price: SOL Drops Below $65 — Analyst Eyes $77 Target as Buy Signal Flashes
TLDR
- SOL is trading below $65, sitting well under its 50-, 100-, and 200-day moving averages, pointing to a bearish trend.
- SOL ETFs saw $794,270 in inflows on Tuesday, but this follows $6.52 million in weekly outflows the prior week, showing mixed institutional demand.
- Open Interest in SOL futures has dropped to around $4.41–$4.57 billion, down from a peak near $17 billion, as traders pull back on leverage.
- Exchange flows have improved since March, with recent sessions showing moderate net inflows, suggesting some accumulation is building.
- Analyst Ali Charts has flagged a TD Sequential buy signal on SOL, pointing to a potential move toward the $77 resistance cluster.
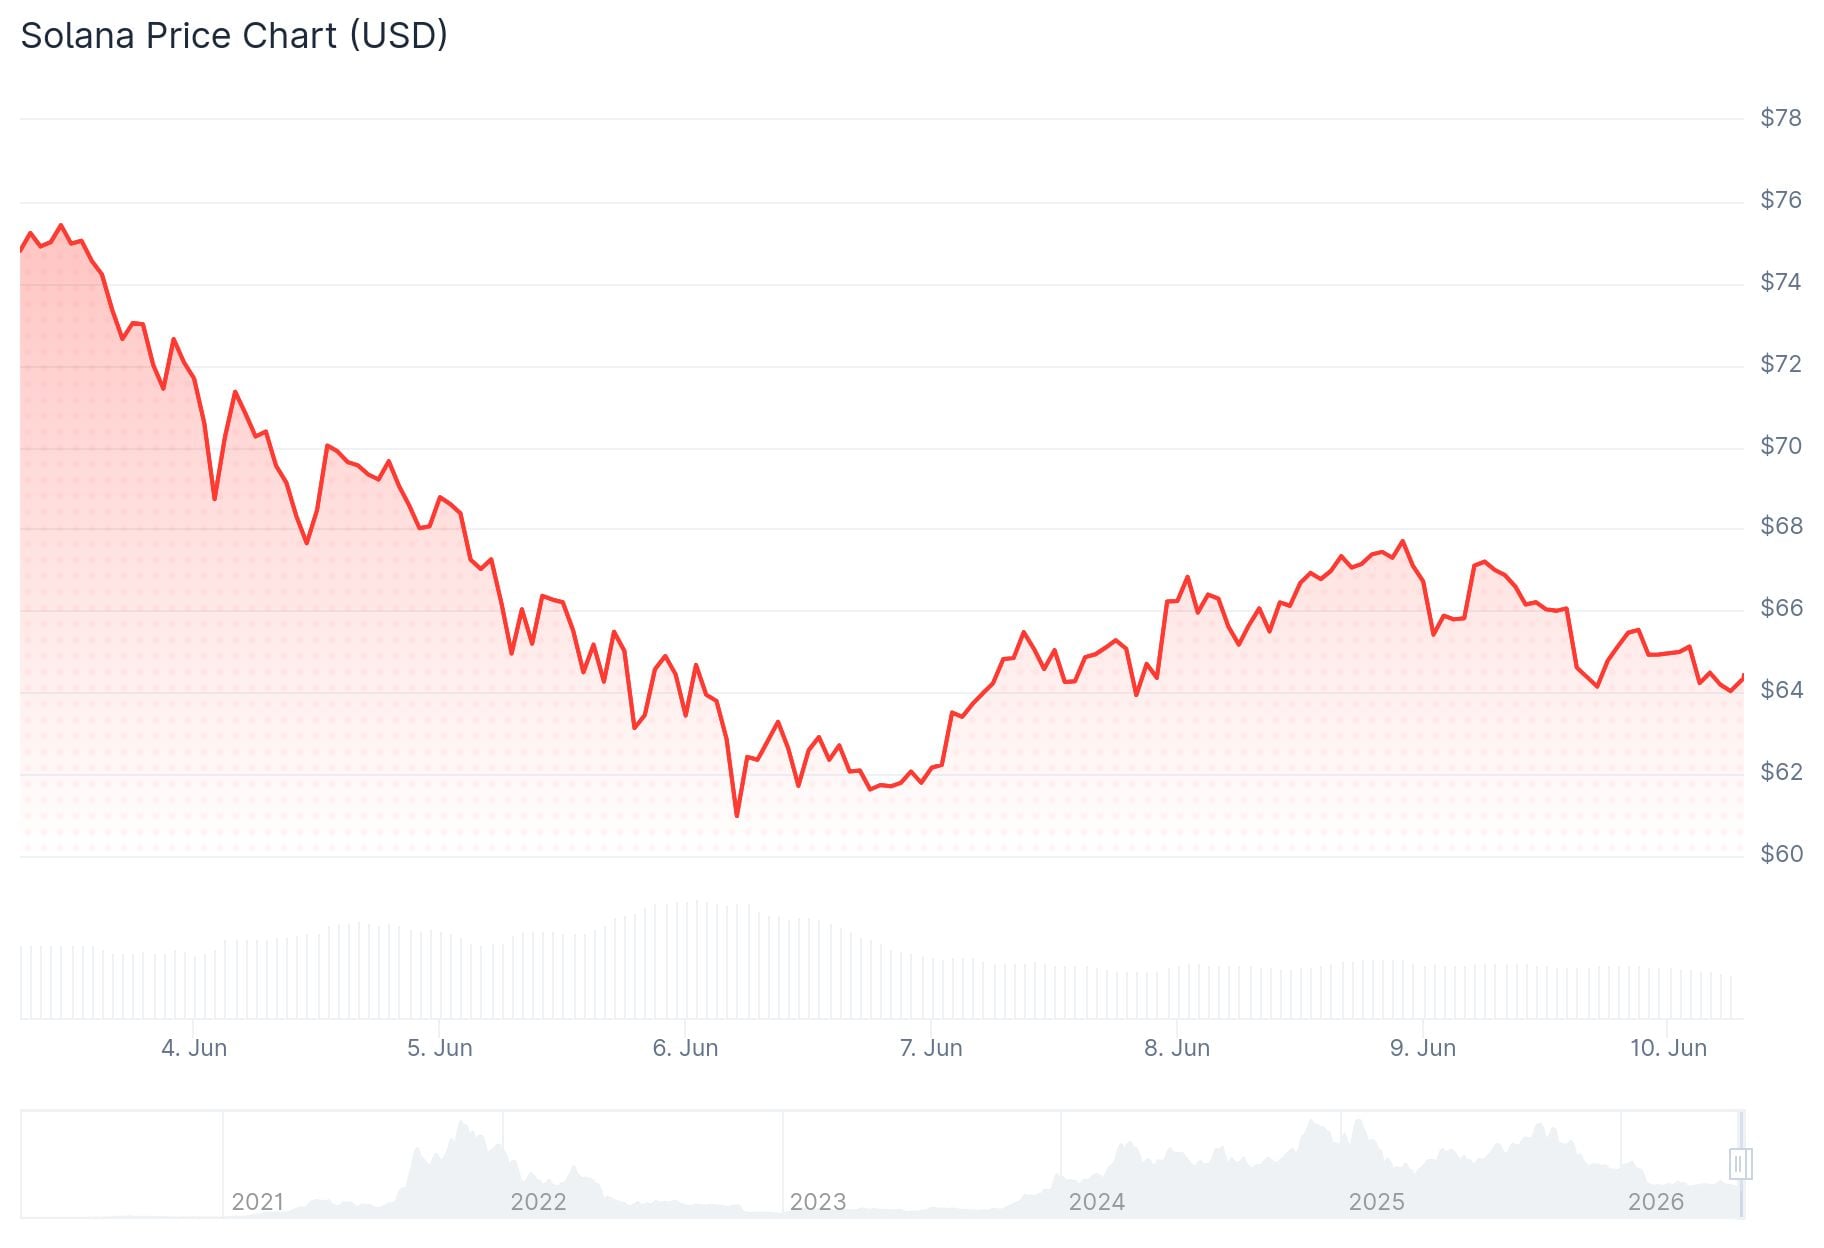
Solana has been under steady selling pressure for weeks, and Wednesday’s session did little to change that picture. SOL is trading around $64–$66, well below its key moving averages, and the path to recovery still has several hurdles ahead.
 Solana (SOL) Price
The cryptocurrency bounced from a low of around $60.13 on Sunday, briefly recovering some ground. But that rebound has stalled. The coin remains below its 50-day EMA at $80.25, its 100-day EMA at $87.22, and its 200-day EMA at $102.96. That alignment keeps the broader trend firmly in bearish territory.
Immediate support sits at $65.59, which lines up with the 0.236 Fibonacci retracement level. Below that, there is a demand zone between $63 and $64, followed by the critical swing low at $60.13–$60.17. If that floor breaks, analysts are watching the $59.11 level, which dates back to December 2023. A drop past that could open the door to $51.28, near the key $50 psychological mark.
ETF Flows Tell a Mixed Story
On the institutional side, SOL-focused ETFs recorded $794,270 in inflows on Tuesday. That came after $471,650 in outflows the day before. Zoom out further, and the picture gets cloudier — the prior week saw $6.52 million in total outflows. That kind of week-to-week inconsistency reflects uncertain institutional conviction in the asset right now.
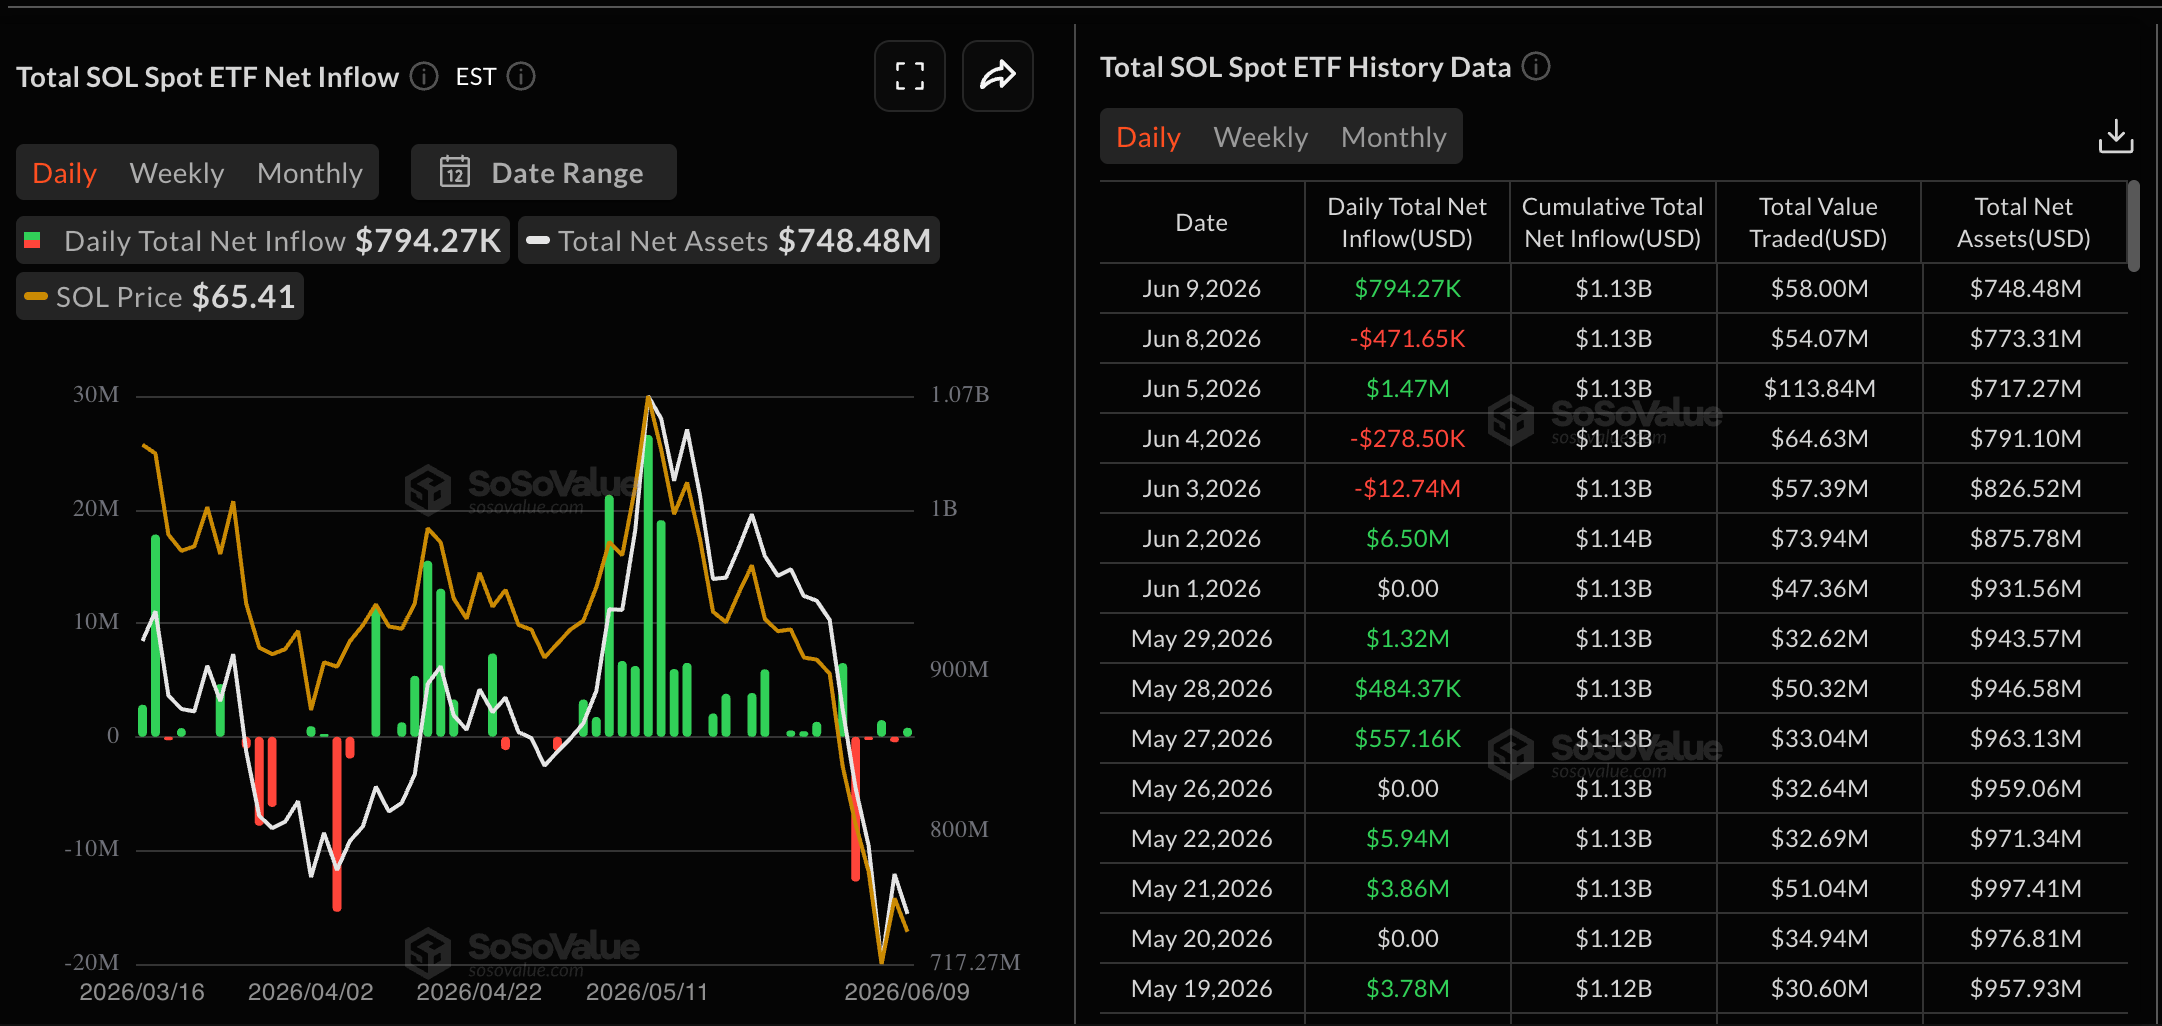 Source: SoSo Value
Retail participation has also cooled. Funding rates, which had been negative at -0.0325% on Sunday, eased to around -0.0042% by Wednesday, meaning leverage-driven selling has softened. But Open Interest in SOL futures still dropped roughly 2% in the past 24 hours to $4.41 billion. Long liquidations totaled $8.29 million of the $11.36 million in 24-hour liquidations, reflecting continued weakness in bullish positioning.
Derivatives Stabilize but Stay Selective
Open Interest peaked near $17 billion earlier this year during Solana’s rally. Since that peak unwound, it has settled into a narrower band between roughly $4.5 billion and $6 billion. The latest reading of around $4.57 billion suggests traders are still present in the market but are not adding leverage aggressively.
Spot market data offers a slightly brighter picture. Since March, exchange inflows and outflows have been more balanced, and recent sessions have even shown moderate net inflows. That points to some early accumulation activity, even if a confirmed trend reversal has not materialized.
Analyst Flags Potential Buy Signal
Crypto analyst Ali Charts posted on X that a TD Sequential buy signal has appeared on the Solana chart. “If it plays out, a move to the $77 resistance cluster could be next,” the analyst wrote. That lines up with the technical picture — a recovery above $67.50 could target $75.63, followed by the 50-day EMA near $80.25.
The RSI is currently hovering around 26, in oversold territory. That does not automatically mean a reversal is coming, but it does suggest the selling pace could slow.
On the downside, resistance near $68.94–$69.48 remains the key zone bulls need to clear to shift market sentiment.
The post Solana (SOL) Price: SOL Drops Below $65 — Analyst Eyes $77 Target as Buy Signal Flashes appeared first on CoinCentral.


Ayrıca Şunları da Beğenebilirsiniz

Ethereum price analysis after BitMine buys another 75,000 ETH

Big Tech Companies Borrow Billions as AI Spending Reaches Historic Levels

Bitcoin Economic Empowerment Gains Support from Saylor


Popüler Haberler
Daha fazla
