

Bitcoin Price Prediction: What Is BTC’s Most Likely Scenario This Week?
Bitcoin continues to trade under heavy pressure after losing several key support levels in quick succession. The recent breakdown has pushed the asset into a significant demand region around $60K, while on-chain data suggests older coins are increasingly moving to exchanges, adding another layer of caution for market participants.
Bitcoin Price Analysis: The Daily Chart
On the daily timeframe, BTC’s recent breakdown was followed by an aggressive selloff that pushed the price toward a major support zone between approximately $59K and $62K. This area previously acted as a strong accumulation region and is currently providing the first meaningful reaction from buyers. The latest candles show a modest bounce from the lows around $59.1K, but the recovery remains limited so far.
The broader structure remains bearish as long as Bitcoin trades below the former support area around $66K to $67K. Any recovery rally is likely to encounter resistance there first. Above that, the next major supply zone sits around $72K to $74K, which coincides with the breakdown region and could attract renewed selling pressure.
A sustained hold above $60K could allow for a relief rally, but reclaiming the $66K to $74K range would be necessary to improve the larger market structure. Failure to defend the current demand zone could expose Bitcoin to a deeper correction below the recent lows.
BTC/USDT 4-Hour Chart
The 4-hour chart provides a clearer view of the recent breakdown. Following the rejection, the price lost the key $72K to $74K supply area before breaking below the intermediate support around $65K. The selloff accelerated afterward, creating a sharp, impulsive move toward the blue demand zone near $60K.
For now, buyers are attempting to stabilize the market within this support region. However, the recent rebound appears corrective rather than impulsive. As long as Bitcoin remains below the broken support at $65K and beneath the former consolidation zone around $72K to $74K, the short-term trend favors the bears.
A recovery above $65K would be the first sign that downside momentum is weakening. Until then, traders will likely monitor the current support closely for either a stronger reversal or another leg lower.
Onchain Analysis
The Exchange Inflow Spent Output Age Bands chart reveals a noticeable increase in exchange deposits from older coins, particularly the 3-6 month and 6-12 month cohorts. Recent spikes are among the largest visible on the chart and have appeared while Bitcoin has been trending lower.
Historically, elevated exchange inflows from older holders can indicate growing distribution activity, as coins that have remained dormant for several months are moved back to exchanges where they can potentially be sold. While a single spike does not guarantee further downside, repeated inflow surges during a declining market often reflect weakening holder conviction.
The latest data suggests that medium-term holders have become increasingly active during the recent correction. If these inflows persist, they could continue to generate supply pressure and make a sustained recovery more difficult in the near term.
Overall, Bitcoin is attempting to defend a critical support zone around $60K to $62K. While a short-term bounce is underway, both market structure and on-chain activity suggest that bulls still face significant work before a broader trend reversal can be confirmed.
The post Bitcoin Price Prediction: What Is BTC’s Most Likely Scenario This Week? appeared first on CryptoPotato.


Ayrıca Şunları da Beğenebilirsiniz
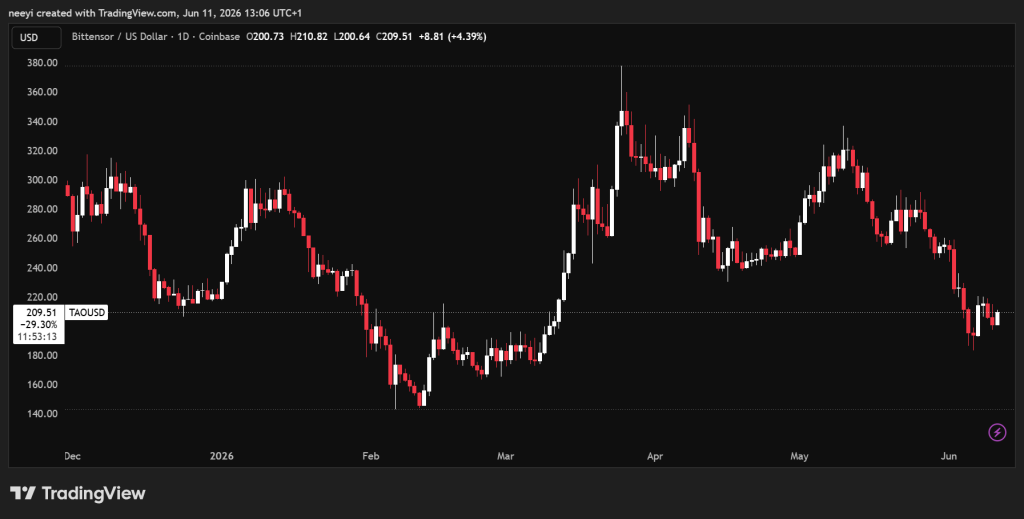
Bittensor (TAO) Retests January Lows Again: Another Buy Signal or a Trap?

Michael Saylor and Jack Mallers Clash Over Strategy’s Bitcoin Reporting Metrics

Trump says US will hit Iran ‘very hard tonight’


Popüler Haberler
Daha fazla
