Buy Crypto
Markets
Spot
FuturesBTC
Earn
Event Center
Rewards Hub
More
How to Use the Psychological Line (PSY) Indicator in Trading: A Complete Beginner's GuideHow to Use the Psychological Line (PSY) Indicator in Trading: A Complete Beginner's Guide
Category List
Cancel

How to Use the Psychological Line (PSY) Indicator in Trading: A Complete Beginner's Guide

Key Takeaways:

  • Psychological Line (PSY) is a momentum-based technical indicator that measures market sentiment between buyers and sellers, with values ranging from 0 to 100.
  • PSY calculates the percentage of price-increasing periods within a specific timeframe to identify potential overbought and oversold conditions.
  • A PSY value above 75 is generally considered overbought, while a value below 25 indicates oversold conditions. The 50 level represents a balance between buying and selling pressure.
  • PSY should not be used alone. Traders are advised to combine it with other indicators, such as RSI and Moving Average, to confirm signals.
  • MEXC users can add the PSY indicator to candlestick charts to support crypto trading decisions.

1. What Is Psychological Line (PSY)?


Psychological Line (PSY) is a sentiment-based technical indicator that measures market optimism and pessimism over a specific period.

When prices continue rising, traders may become increasingly optimistic or even overly confident. When prices continue falling, market sentiment may become more negative or fearful.

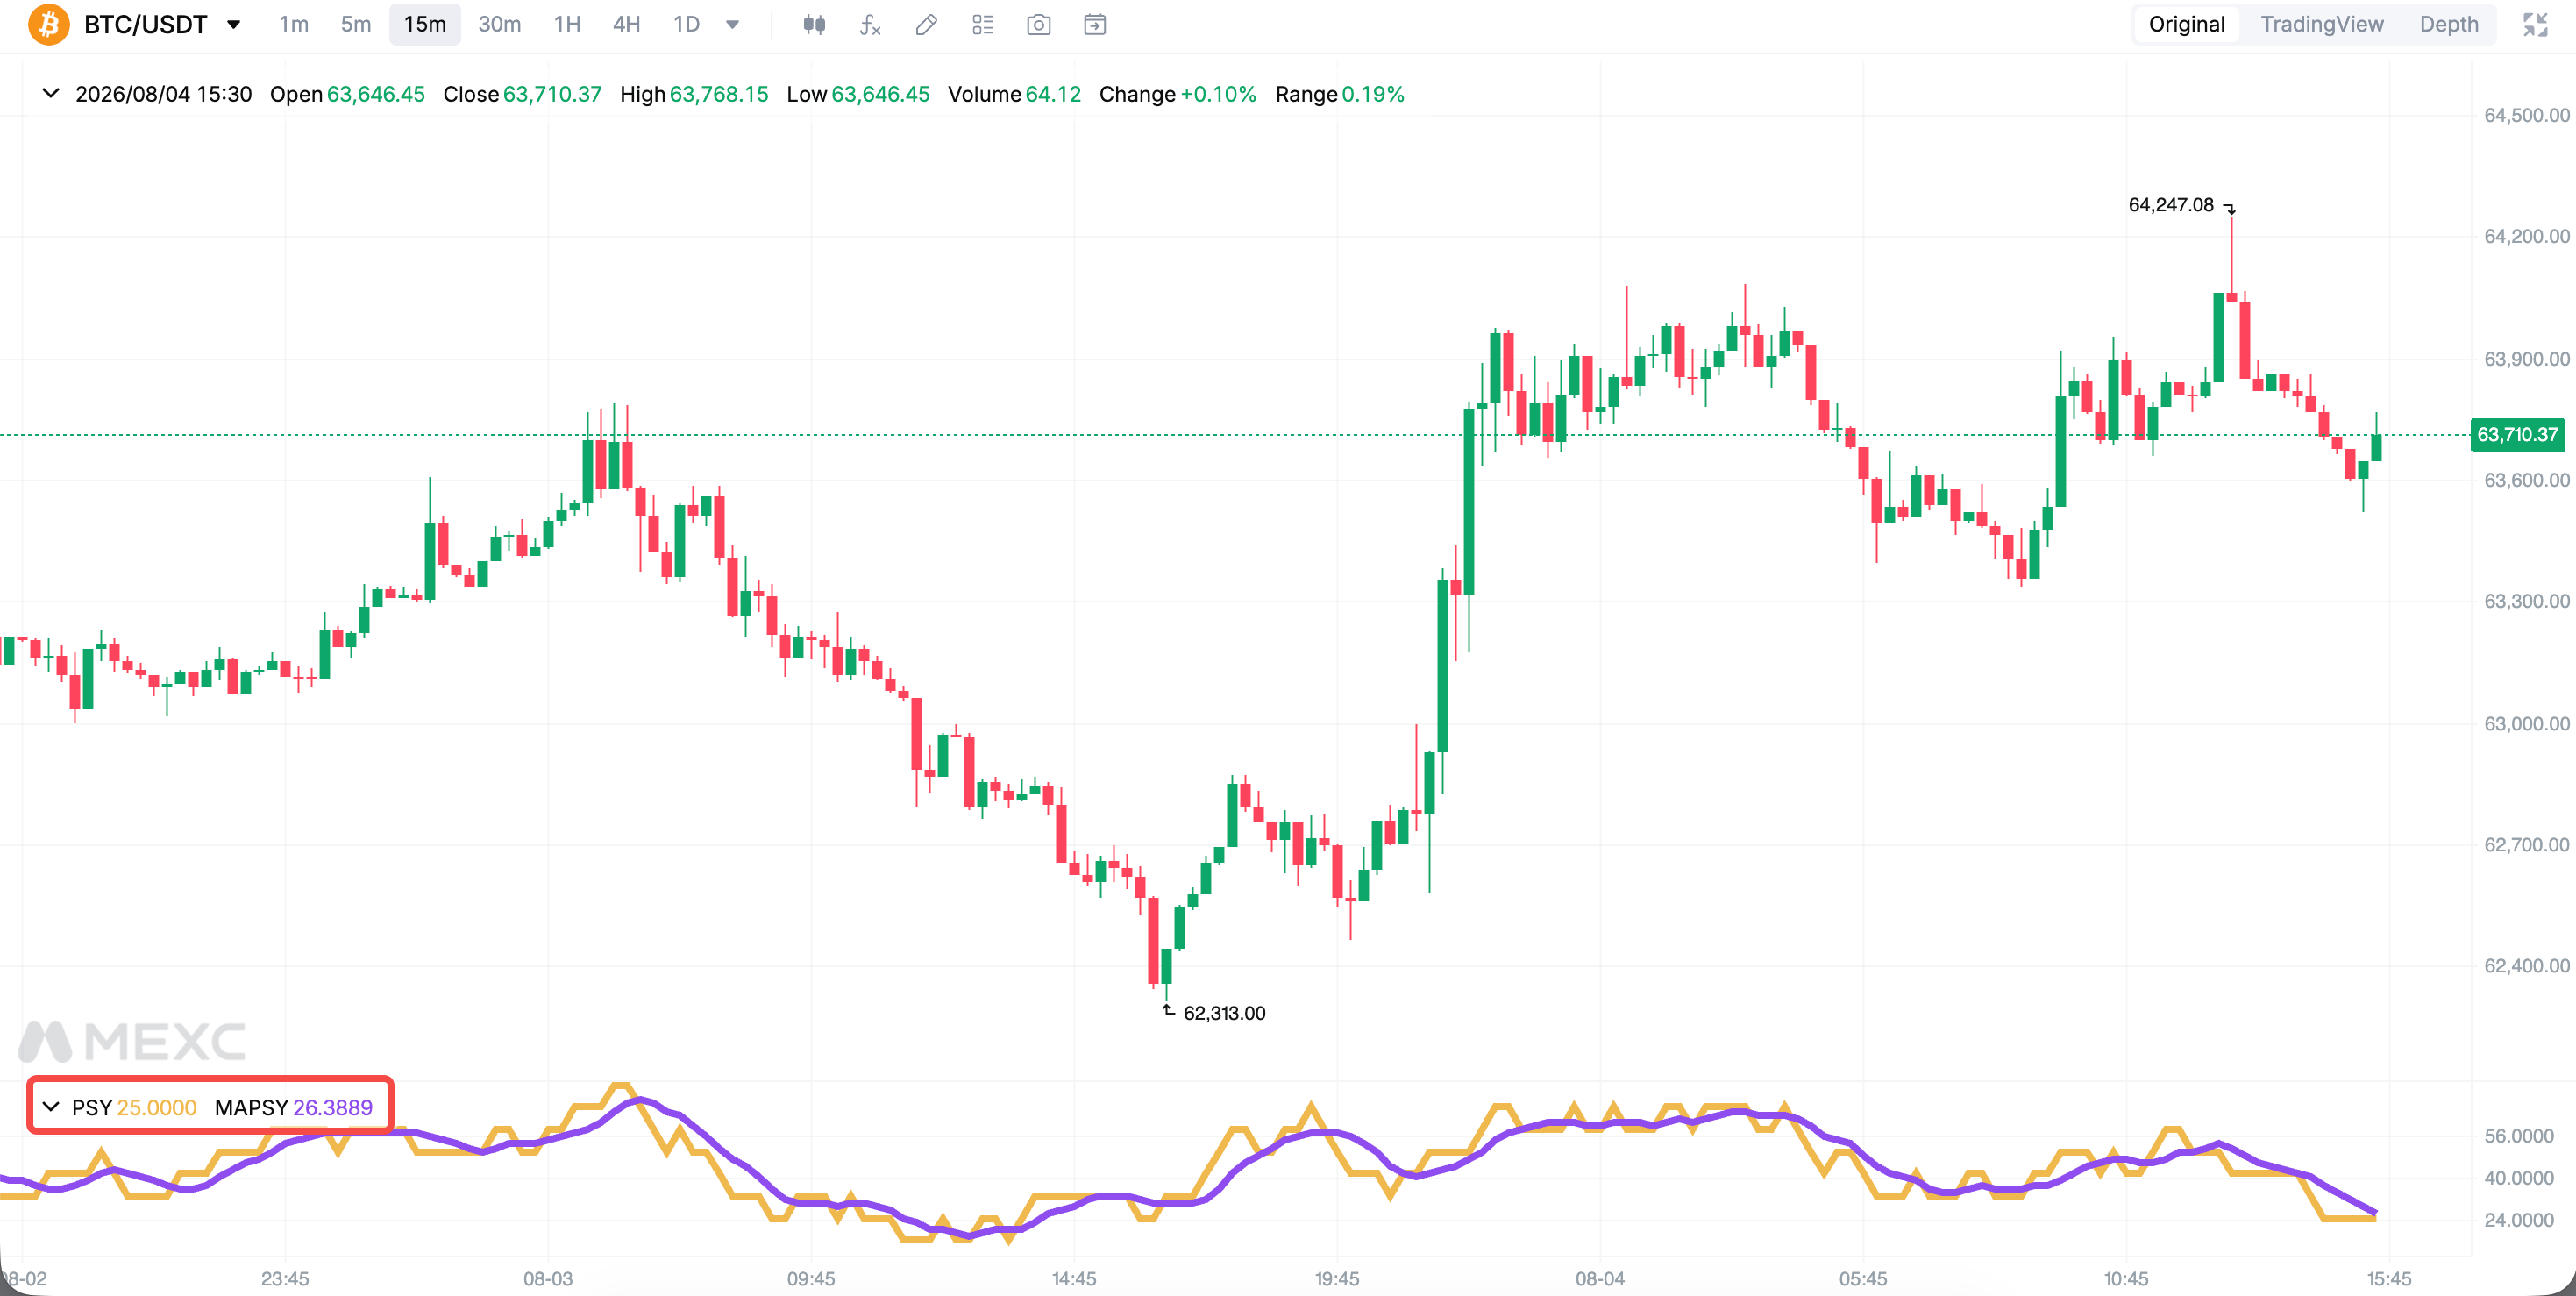
PSY quantifies market sentiment by calculating the percentage of rising periods within a given timeframe. Its value ranges from 0 to 100:
  • A value of 100 means all periods recorded price increases.
  • A value of 0 means all periods recorded price declines.
  • A value of 50 means rising and declining periods are evenly balanced.

In crypto markets, where price movements are often highly volatile and sentiment-driven, PSY can provide useful references for identifying potentially overheated or oversold market conditions. MEXC's charting tools allow users to directly add the PSY indicator for market analysis.

2. How To Interpret PSY Values


Overbought and Oversold Levels:
When PSY rises above 75, it suggests that the market has experienced too many consecutive price increases and investor sentiment may have become overly optimistic. This may indicate overbought conditions and a higher possibility of a pullback.

When PSY falls below 25, it suggests excessive pessimism and possible oversold conditions, where a rebound may become more likely.

Extreme readings above 90 or below 10 may indicate that market sentiment has reached an excessive level and a potential reversal could be approaching.

The Significance of the 50 Level:
A move above 50 from below may indicate strengthening buying momentum.

A drop below 50 from above may suggest increasing selling pressure.

When PSY remains above 50 for an extended period, buyers may be dominating the market. When it stays below 50, sellers may have greater control.

Divergence Signals:
PSY divergence occurs when price movements and the indicator move in different directions.

When price reaches a new high but PSY fails to rise accordingly, it may indicate weakening upward momentum and a potential reversal risk. When price reaches a new low but PSY starts recovering, it may suggest that selling pressure is weakening and a potential bottom may be forming.

Divergence is one of the key signals traders can monitor when using PSY.

3. How To Use PSY in Trading


1) Use PSY as a Sentiment Filter
In an uptrend, when PSY falls below 25 and enters oversold area, traders can combine price action signals to look for potential entry opportunities after a pullback.
In a downtrend, when PSY rises above 75, traders can monitor potential short opportunities or consider reducing exposure.

2) Combine PSY With Other Indicators
PSY only measures the ratio of rising and declining periods and does not reflect the size of price changes.
To improve signal reliability, traders can combine PSY with other technical indicators, such as RSI, MACD, and volume indicators.

3) Wait for Confirmation After Extreme Readings
Traders should avoid immediately taking a reversal position when PSY first enters overbought or oversold area.

Instead, wait for PSY to move back from extreme levels and confirm the reversal with other signals to avoid entering too early against a strong trend.

MEXC users can add PSY from the indicator list on any trading pair's chart and adjust parameters based on their trading timeframe.


4. Things To Consider When Using PSY


PSY is a relatively simple indicator that only measures the ratio of rising and declining periods without considering the magnitude of price changes.

As a result, it may react slowly during sharp price movements.

PSY does not provide direct buy or sell signals and should only be used to evaluate market sentiment and potential overbought or oversold conditions.

Traders should combine PSY with market trends, price action, volume analysis, and proper risk management. Position sizing and risk control remain essential parts of any trading strategy.

5. PSY FAQ


5.1 How can I use PSY in trading?


After adding PSY to the candlestick chart, monitor key levels such as:
  • Above 75: Potential overbought conditions
  • Below 25: Potential oversold conditions
  • Crosses of the 50 level: Changes in market sentiment
Always confirm signals with price patterns and other indicators before making trading decisions.

5.2 What does PSY represent?


PSY represents the percentage of price-increasing periods within a specific timeframe. It measures market sentiment and reflects the relative strength between buyers and sellers.

5.3 What does a PSY value above 75 mean?


A PSY value above 75 indicates that the market has experienced a high proportion of price increases recently. It suggests strong optimism and potential overbought conditions, with increased pullback risk.

5.4 Can PSY be used as the only trading signal?


No. PSY only measures market sentiment and does not fully reflect price structure or market trends. It should be combined with indicators such as RSI, Moving Average, and volume analysis.

5.5 Does psychology play a major role in trading?


Psychology plays an important role in trading. Managing emotions and maintaining discipline can significantly affect long-term performance. However, a complete trading system and proper risk management are equally important.

5.6 How can I use PSY on MEXC?


Open any trading pair's chart on MEXC Spot or Futures, then add PSY from Indicators.

Go to MEXC official website → Spot/Futures → Indicators → PSY


Risk Disclaimer: Technical indicators are calculated based on historical data and are provided for reference only. They do not guarantee future market movements. Digital asset markets are highly volatile and involve risks. Please make independent decisions based on your own risk tolerance and avoid relying solely on technical indicators when trading.

How to Use the Psychological Line (PSY) Indicator in Trading: A Complete Beginner's Guide

Key Takeaways:

  • Psychological Line (PSY) is a momentum-based technical indicator that measures market sentiment between buyers and sellers, with values ranging from 0 to 100.
  • PSY calculates the percentage of price-increasing periods within a specific timeframe to identify potential overbought and oversold conditions.
  • A PSY value above 75 is generally considered overbought, while a value below 25 indicates oversold conditions. The 50 level represents a balance between buying and selling pressure.
  • PSY should not be used alone. Traders are advised to combine it with other indicators, such as RSI and Moving Average, to confirm signals.
  • MEXC users can add the PSY indicator to candlestick charts to support crypto trading decisions.

1. What Is Psychological Line (PSY)?


Psychological Line (PSY) is a sentiment-based technical indicator that measures market optimism and pessimism over a specific period.

When prices continue rising, traders may become increasingly optimistic or even overly confident. When prices continue falling, market sentiment may become more negative or fearful.

PSY quantifies market sentiment by calculating the percentage of rising periods within a given timeframe. Its value ranges from 0 to 100:
  • A value of 100 means all periods recorded price increases.
  • A value of 0 means all periods recorded price declines.
  • A value of 50 means rising and declining periods are evenly balanced.

In crypto markets, where price movements are often highly volatile and sentiment-driven, PSY can provide useful references for identifying potentially overheated or oversold market conditions. MEXC's charting tools allow users to directly add the PSY indicator for market analysis.


2. How To Interpret PSY Values


Overbought and Oversold Levels:
When PSY rises above 75, it suggests that the market has experienced too many consecutive price increases and investor sentiment may have become overly optimistic. This may indicate overbought conditions and a higher possibility of a pullback.

When PSY falls below 25, it suggests excessive pessimism and possible oversold conditions, where a rebound may become more likely.

Extreme readings above 90 or below 10 may indicate that market sentiment has reached an excessive level and a potential reversal could be approaching.

The Significance of the 50 Level:
A move above 50 from below may indicate strengthening buying momentum.

A drop below 50 from above may suggest increasing selling pressure.

When PSY remains above 50 for an extended period, buyers may be dominating the market. When it stays below 50, sellers may have greater control.

Divergence Signals:
PSY divergence occurs when price movements and the indicator move in different directions.

When price reaches a new high but PSY fails to rise accordingly, it may indicate weakening upward momentum and a potential reversal risk. When price reaches a new low but PSY starts recovering, it may suggest that selling pressure is weakening and a potential bottom may be forming.

Divergence is one of the key signals traders can monitor when using PSY.

3. How To Use PSY in Trading


1) Use PSY as a Sentiment Filter
In an uptrend, when PSY falls below 25 and enters oversold area, traders can combine price action signals to look for potential entry opportunities after a pullback.
In a downtrend, when PSY rises above 75, traders can monitor potential short opportunities or consider reducing exposure.

2) Combine PSY With Other Indicators
PSY only measures the ratio of rising and declining periods and does not reflect the size of price changes.
To improve signal reliability, traders can combine PSY with other technical indicators, such as RSI, MACD, and volume indicators.

3) Wait for Confirmation After Extreme Readings
Traders should avoid immediately taking a reversal position when PSY first enters overbought or oversold area.

Instead, wait for PSY to move back from extreme levels and confirm the reversal with other signals to avoid entering too early against a strong trend.

MEXC users can add PSY from the indicator list on any trading pair's chart and adjust parameters based on their trading timeframe.


4. Things To Consider When Using PSY


PSY is a relatively simple indicator that only measures the ratio of rising and declining periods without considering the magnitude of price changes.

As a result, it may react slowly during sharp price movements.

PSY does not provide direct buy or sell signals and should only be used to evaluate market sentiment and potential overbought or oversold conditions.

Traders should combine PSY with market trends, price action, volume analysis, and proper risk management. Position sizing and risk control remain essential parts of any trading strategy.

5. PSY FAQ


5.1 How can I use PSY in trading?


After adding PSY to the candlestick chart, monitor key levels such as:
  • Above 75: Potential overbought conditions
  • Below 25: Potential oversold conditions
  • Crosses of the 50 level: Changes in market sentiment
Always confirm signals with price patterns and other indicators before making trading decisions.

5.2 What does PSY represent?


PSY represents the percentage of price-increasing periods within a specific timeframe. It measures market sentiment and reflects the relative strength between buyers and sellers.

5.3 What does a PSY value above 75 mean?


A PSY value above 75 indicates that the market has experienced a high proportion of price increases recently. It suggests strong optimism and potential overbought conditions, with increased pullback risk.

5.4 Can PSY be used as the only trading signal?


No. PSY only measures market sentiment and does not fully reflect price structure or market trends. It should be combined with indicators such as RSI, Moving Average, and volume analysis.

5.5 Does psychology play a major role in trading?


Psychology plays an important role in trading. Managing emotions and maintaining discipline can significantly affect long-term performance. However, a complete trading system and proper risk management are equally important.

5.6 How can I use PSY on MEXC?


Open any trading pair's chart on MEXC Spot or Futures, then add PSY from Indicators.

Go to MEXC official website → Spot/Futures → Indicators → PSY


Risk Disclaimer: Technical indicators are calculated based on historical data and are provided for reference only. They do not guarantee future market movements. Digital asset markets are highly volatile and involve risks. Please make independent decisions based on your own risk tolerance and avoid relying solely on technical indicators when trading.