Is Bitcoin Ready For A Rebound? This Metric Says More Pain Needed First
On-chain data shows the loss margin of Bitcoin traders is only halfway through the way to the boundary that signaled rebounds in the last two years.
Bitcoin Traders Are About 5% Underwater At The Moment
In a new post on X, analyst Ali Martinez has talked about how Bitcoin tends to rebound when the Profit/Loss Margin of the Bitcoin traders falls under -12%. The Profit/Loss Margin refers to an indicator that measures the net amount of profit or loss that the BTC investors are carrying right now.
The metric works by going through the transaction history of each coin on the blockchain to see what price it was last moved at. If this previous price for any token was less than the current spot price, then it’s considered to be carrying a profit equal to the difference between the two prices. Similarly, tokens of the opposite type fall into the loss category.
The Profit/Loss Margin calculates the net unrealized profit or loss (as a percentage) that investors as a whole are carrying. In the context of the current topic, the version of the metric that’s of interest specifically tracks this margin for the “traders,” investors who have been holding their coins since between 1 and 3 months ago.
Now, here is the chart shared by Martinez that shows the trend in the Bitcoin Profit/Loss Margin of the traders, as well as its 30-day simple moving average (SMA), over the last couple of years:
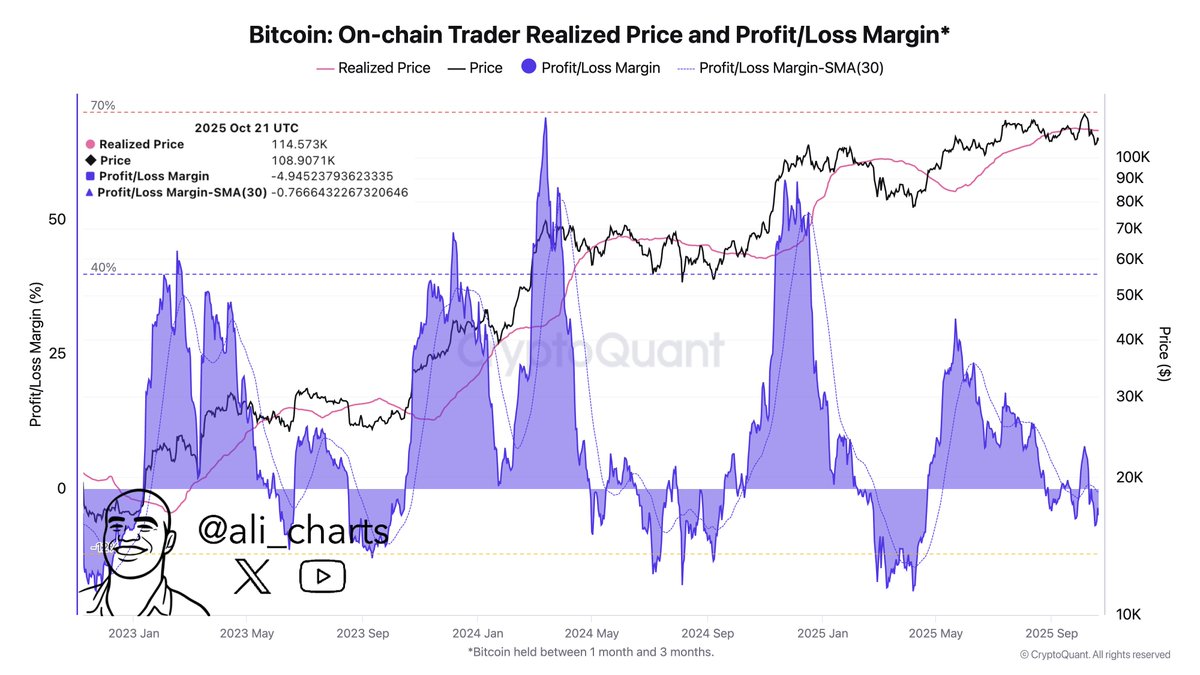
As is visible in the above graph, the Profit/Loss Margin of the Bitcoin traders has witnessed a plunge into the negative territory recently as BTC’s price has gone through its bearish action. Currently, the 1 to 3 months old BTC buyers are sitting about 5% underwater.
The analyst has pointed out that BTC has tended to find rebounds when these holders have been under a notable amount of pressure during the last two years. The cutoff for this distress threshold, however, lies at -12%, a level that the trader Profit/Loss Margin is still to breach under.
It now remains to be seen whether Bitcoin will be able to find a bottom in the near future, or if one will only happen after traders experience a similar degree of pain as the previous lows.
In another X post, Martinez has highlighted that $119,750 could be a crucial mark for Bitcoin to reclaim, as it represents a key resistance level in the MVRV Extreme Deviation Pricing Bands, a pricing model for BTC based on standard deviations of the popular MVRV Ratio.
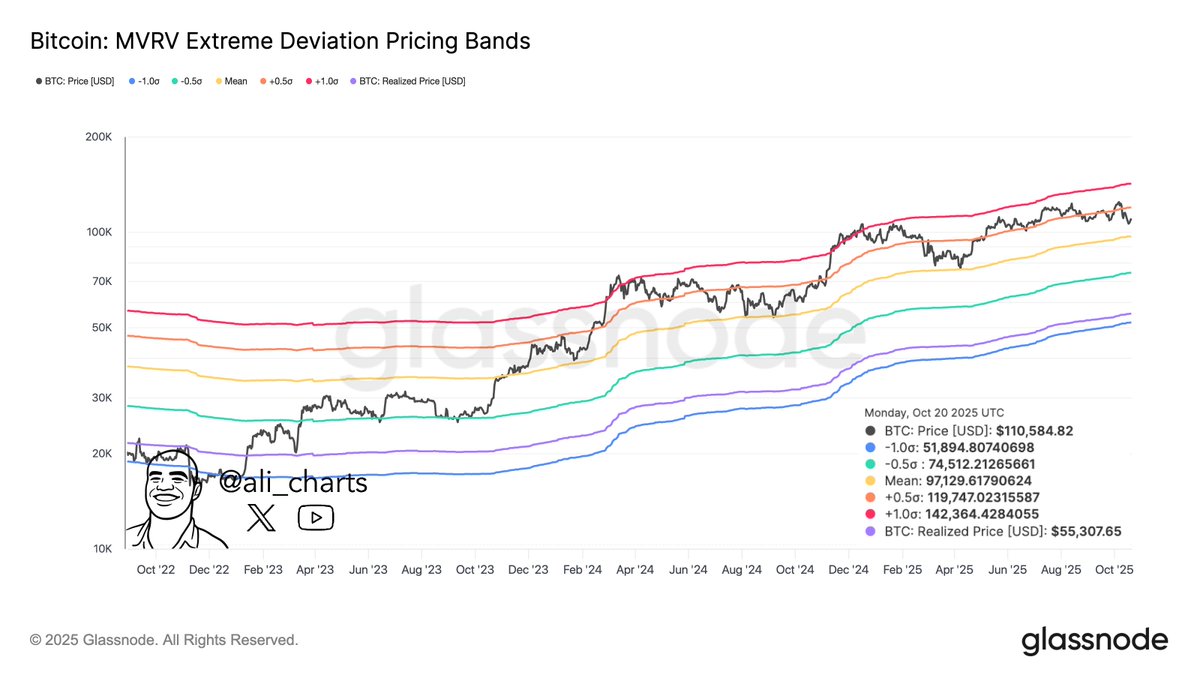
“Failing to reclaim it could trigger a move down to $97,130 or even $74,500,” noted the analyst.
BTC Price
Bitcoin’s latest recovery was quite short-lived as its value is already back to $108,000.
You May Also Like

Ferrari plans to launch digital token 'Token Ferrari 499P'
De XRP koers stijgt circa 5% terwijl de whales $22,7 miljoen aan tokens van exchanges halen