

Chainlink price hanging on a thread as LINK reserves hit $10m
Chainlink price has crashed by 35% from the September high, and a Murrey Math Lines analysis points to more downside despite the ongoing Strategic LINK Reserves growth.
- Chainlink price may be at risk of a bearish breakout in the near term.
- LINK token may crash despite its LINK reserves hitting $10 million.
- Murrey Math Lines points to a drop to $12 in the near term.
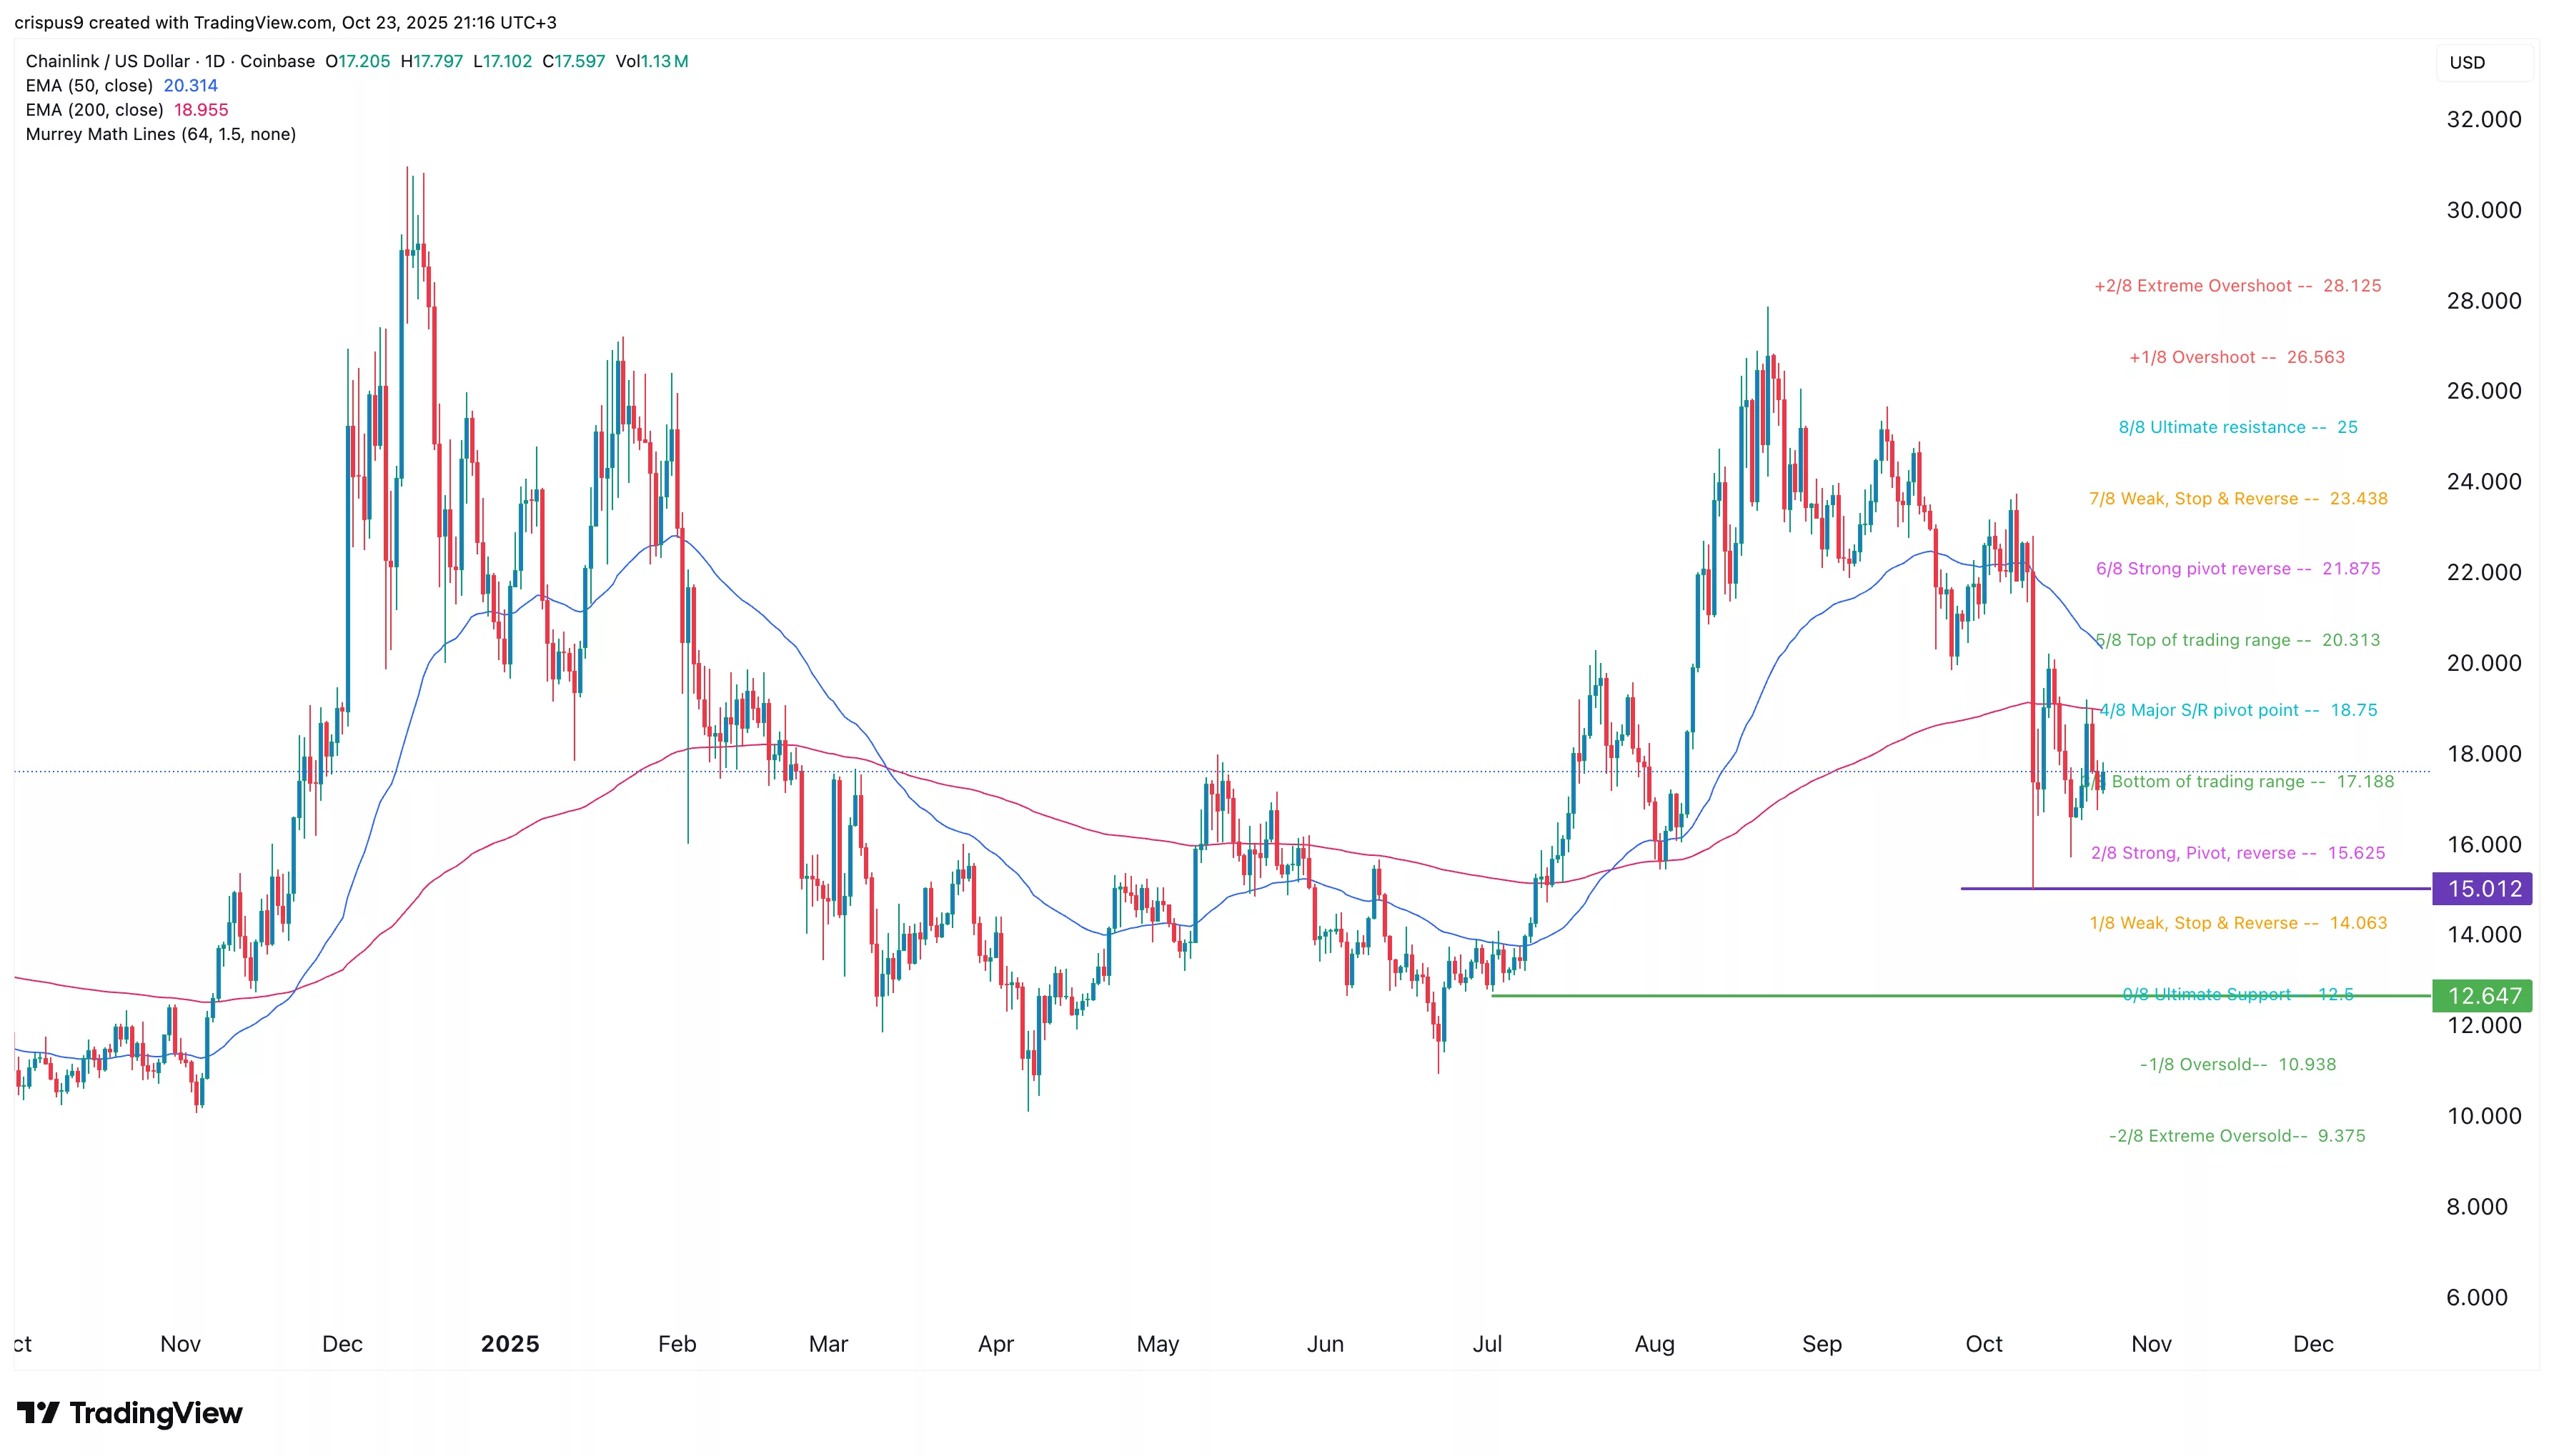
Chainlink (LINK) token was trading at $17.7 on Oct. 23, a level it has remained at in the past few days. It is a few points above the lowest level this month.
Chainlink price technicals points to more downside
The daily chart shows that the LINK price plunged to a multi-month low of $15 during the Oct. 11 crypto market crash. It has remained in a consolidation phase since then.
The coin has remained below the 50-day and 200-day Exponential Moving Averages and is about to form a death cross pattern.
Most importantly, the coin is in the process of forming a bearish pennant pattern. This pattern is made up of a vertical line and is now forming the triangle section.
Therefore, the token will likely have a strong bearish breakout, potentially to the key support at $15, its lowest point on Oct. 11. A move below that level could lead to more downside, potentially to the ultimate support at $12.64, the ultimate support of the Murrey Math Lines tool.
The bearish Chainlink price forecast will be invalidated if it moves above the psychological point at $20. A move above that level will point to more gains to the ultimate resistance at $25.
Strategic LINK Reserves jumps
One potential catalyst is that the Strategic LINK Reserves have continued rising in the past few weeks. Chainlink announced that it acquired over 63,481 tokens this week, bringing the current reserve size to 586,640.
The value of these tokens is worth about $10.3 million, a notable amount for a program started a few months ago. It involves using on-chain and off-chain fees to buy LINK tokens.
Chainlink price may also benefit from the ongoing whale accumulation. Data shows that whales hold about 2.97 million LINK tokens, up from 2.52 million tokens. Also, the amount of tokens in exchanges dropped to 266 million, down from last month’s high of 283 million tokens.
You May Also Like

Santander’s Openbank Sparks Crypto Frenzy in Germany

BetFury is at SBC Summit Lisbon 2025: Affiliate Growth in Focus

ISM Manufacturing PMI suggests Bitcoin cycle may extend beyond historical norm
Bitcoin’s market cycles may stretch longer as ISM manufacturing data remains weak, hinting at extended macro headwinds and slower business recovery. The Institute for Supply Management’s (ISM) Manufacturing Purchasing Managers’ Index (PMI) has historically aligned with major peaks in Bitcoin’s market cycles — a pattern that, if repeated, could imply a longer-than-usual cycle this time around.The correlation between the ISM PMI and Bitcoin’s (BTC) price was first popularized by Real Vision’s Raoul Pal and has since gained traction among macro-focused crypto analysts.“All 3 past Bitcoin cycle tops have broadly aligned with this monthly, oscillating index,” analyst Colin Talks Crypto noted, referencing the recurring overlap between Bitcoin’s market highs and the PMI’s cyclical peaks.Read more