On-chain analytics firm Glassnode has explained how Bitcoin losing $108,500 could lead to a deeper correction, if the past pattern is to go by. Bitcoin Is At Risk Of Losing The 0.85 Quantile Level In its latest weekly report, analytics firm Glassnode has talked about how Bitcoin is currently looking from the perspective of the Supply Quantiles Cost Basis model. This model maps price levels according to the amount of BTC supply that would be lost if the cryptocurrency were to trade at its current price today. There are three supply “quantiles” involved in the indicator: 0.95, 0.85, and 0.75, corresponding to levels where 5%, 15%, and 25% of the supply would be held at a loss, respectively. Related Reading: Is Bitcoin Ready For A Rebound? This Metric Says More Pain Needed First Below is the chart shared by Glassnode that shows the trend in the different Bitcoin supply quantiles over the last few years. As is visible in the graph, Bitcoin surged above the 0.95 quantile during its price rally earlier in the month, as the supply in profit approached the 100% mark during the new all-time high (ATH). With the recent bearish action, however, the cryptocurrency has fallen below the line and is now trading around the 0.85 quantile situated at $108,600. Thus, it would appear that about 15% of the BTC supply is in the red at the moment. Bitcoin has already faced dips below this mark, so it’s possible that the coin may be at risk of losing the line. “Historically, failure to hold this threshold has signalled structural market weakness and often preceded deeper corrections toward the 0.75 quantile,” explained the analytics firm. BTC last saw such a decline to the 0.75 quantile during the consolidation period in mid-2024. Currently, this level is equivalent to $97,500. It now remains to be seen whether the asset can maintain above the 0.85 quantile, and if not, whether a retest of the 0.75 quantile will take place. The 0.95 quantile isn’t the only level that Bitcoin has lost during the recent drawdown; its price has also dropped below the average cost basis of the short-term holders (STHs) located at $113,100. STHs here refer to the BTC investors who purchased their coins within the past 155 days. This group is considered to represent the fragile side of the market, prone to making panic moves during times of volatility. With BTC dropping below the cost basis of the cohort, its members are now underwater. “Historically, this structure often precedes the onset of a mid-term bearish phase, as weaker hands begin to capitulate,” noted Glassnode. Related Reading: Bitcoin Cycle Top Still Not In, Suggests NVT Golden Cross In an X post, the analytics firm has shared a chart that puts into perspective the net unrealized loss held by the Bitcoin STHs right now. BTC Price Bitcoin hasn’t been able to sustain a recovery recently as its price is still trading around $109,100. Featured image from Dall-E, Glassnode.com, chart from TradingView.comOn-chain analytics firm Glassnode has explained how Bitcoin losing $108,500 could lead to a deeper correction, if the past pattern is to go by. Bitcoin Is At Risk Of Losing The 0.85 Quantile Level In its latest weekly report, analytics firm Glassnode has talked about how Bitcoin is currently looking from the perspective of the Supply Quantiles Cost Basis model. This model maps price levels according to the amount of BTC supply that would be lost if the cryptocurrency were to trade at its current price today. There are three supply “quantiles” involved in the indicator: 0.95, 0.85, and 0.75, corresponding to levels where 5%, 15%, and 25% of the supply would be held at a loss, respectively. Related Reading: Is Bitcoin Ready For A Rebound? This Metric Says More Pain Needed First Below is the chart shared by Glassnode that shows the trend in the different Bitcoin supply quantiles over the last few years. As is visible in the graph, Bitcoin surged above the 0.95 quantile during its price rally earlier in the month, as the supply in profit approached the 100% mark during the new all-time high (ATH). With the recent bearish action, however, the cryptocurrency has fallen below the line and is now trading around the 0.85 quantile situated at $108,600. Thus, it would appear that about 15% of the BTC supply is in the red at the moment. Bitcoin has already faced dips below this mark, so it’s possible that the coin may be at risk of losing the line. “Historically, failure to hold this threshold has signalled structural market weakness and often preceded deeper corrections toward the 0.75 quantile,” explained the analytics firm. BTC last saw such a decline to the 0.75 quantile during the consolidation period in mid-2024. Currently, this level is equivalent to $97,500. It now remains to be seen whether the asset can maintain above the 0.85 quantile, and if not, whether a retest of the 0.75 quantile will take place. The 0.95 quantile isn’t the only level that Bitcoin has lost during the recent drawdown; its price has also dropped below the average cost basis of the short-term holders (STHs) located at $113,100. STHs here refer to the BTC investors who purchased their coins within the past 155 days. This group is considered to represent the fragile side of the market, prone to making panic moves during times of volatility. With BTC dropping below the cost basis of the cohort, its members are now underwater. “Historically, this structure often precedes the onset of a mid-term bearish phase, as weaker hands begin to capitulate,” noted Glassnode. Related Reading: Bitcoin Cycle Top Still Not In, Suggests NVT Golden Cross In an X post, the analytics firm has shared a chart that puts into perspective the net unrealized loss held by the Bitcoin STHs right now. BTC Price Bitcoin hasn’t been able to sustain a recovery recently as its price is still trading around $109,100. Featured image from Dall-E, Glassnode.com, chart from TradingView.com

Bitcoin Could Drop To $97,500 If This Key On-Chain Level Fails, Glassnode Warns

2025/10/24 10:00

On-chain analytics firm Glassnode has explained how Bitcoin losing $108,500 could lead to a deeper correction, if the past pattern is to go by.

Bitcoin Is At Risk Of Losing The 0.85 Quantile Level

In its latest weekly report, analytics firm Glassnode has talked about how Bitcoin is currently looking from the perspective of the Supply Quantiles Cost Basis model. This model maps price levels according to the amount of BTC supply that would be lost if the cryptocurrency were to trade at its current price today. There are three supply “quantiles” involved in the indicator: 0.95, 0.85, and 0.75, corresponding to levels where 5%, 15%, and 25% of the supply would be held at a loss, respectively.

Below is the chart shared by Glassnode that shows the trend in the different Bitcoin supply quantiles over the last few years.

Bitcoin Supply Quantiles Model

As is visible in the graph, Bitcoin surged above the 0.95 quantile during its price rally earlier in the month, as the supply in profit approached the 100% mark during the new all-time high (ATH). With the recent bearish action, however, the cryptocurrency has fallen below the line and is now trading around the 0.85 quantile situated at $108,600. Thus, it would appear that about 15% of the BTC supply is in the red at the moment.

Bitcoin has already faced dips below this mark, so it’s possible that the coin may be at risk of losing the line. “Historically, failure to hold this threshold has signalled structural market weakness and often preceded deeper corrections toward the 0.75 quantile,” explained the analytics firm.

BTC last saw such a decline to the 0.75 quantile during the consolidation period in mid-2024. Currently, this level is equivalent to $97,500. It now remains to be seen whether the asset can maintain above the 0.85 quantile, and if not, whether a retest of the 0.75 quantile will take place.

The 0.95 quantile isn’t the only level that Bitcoin has lost during the recent drawdown; its price has also dropped below the average cost basis of the short-term holders (STHs) located at $113,100. STHs here refer to the BTC investors who purchased their coins within the past 155 days.

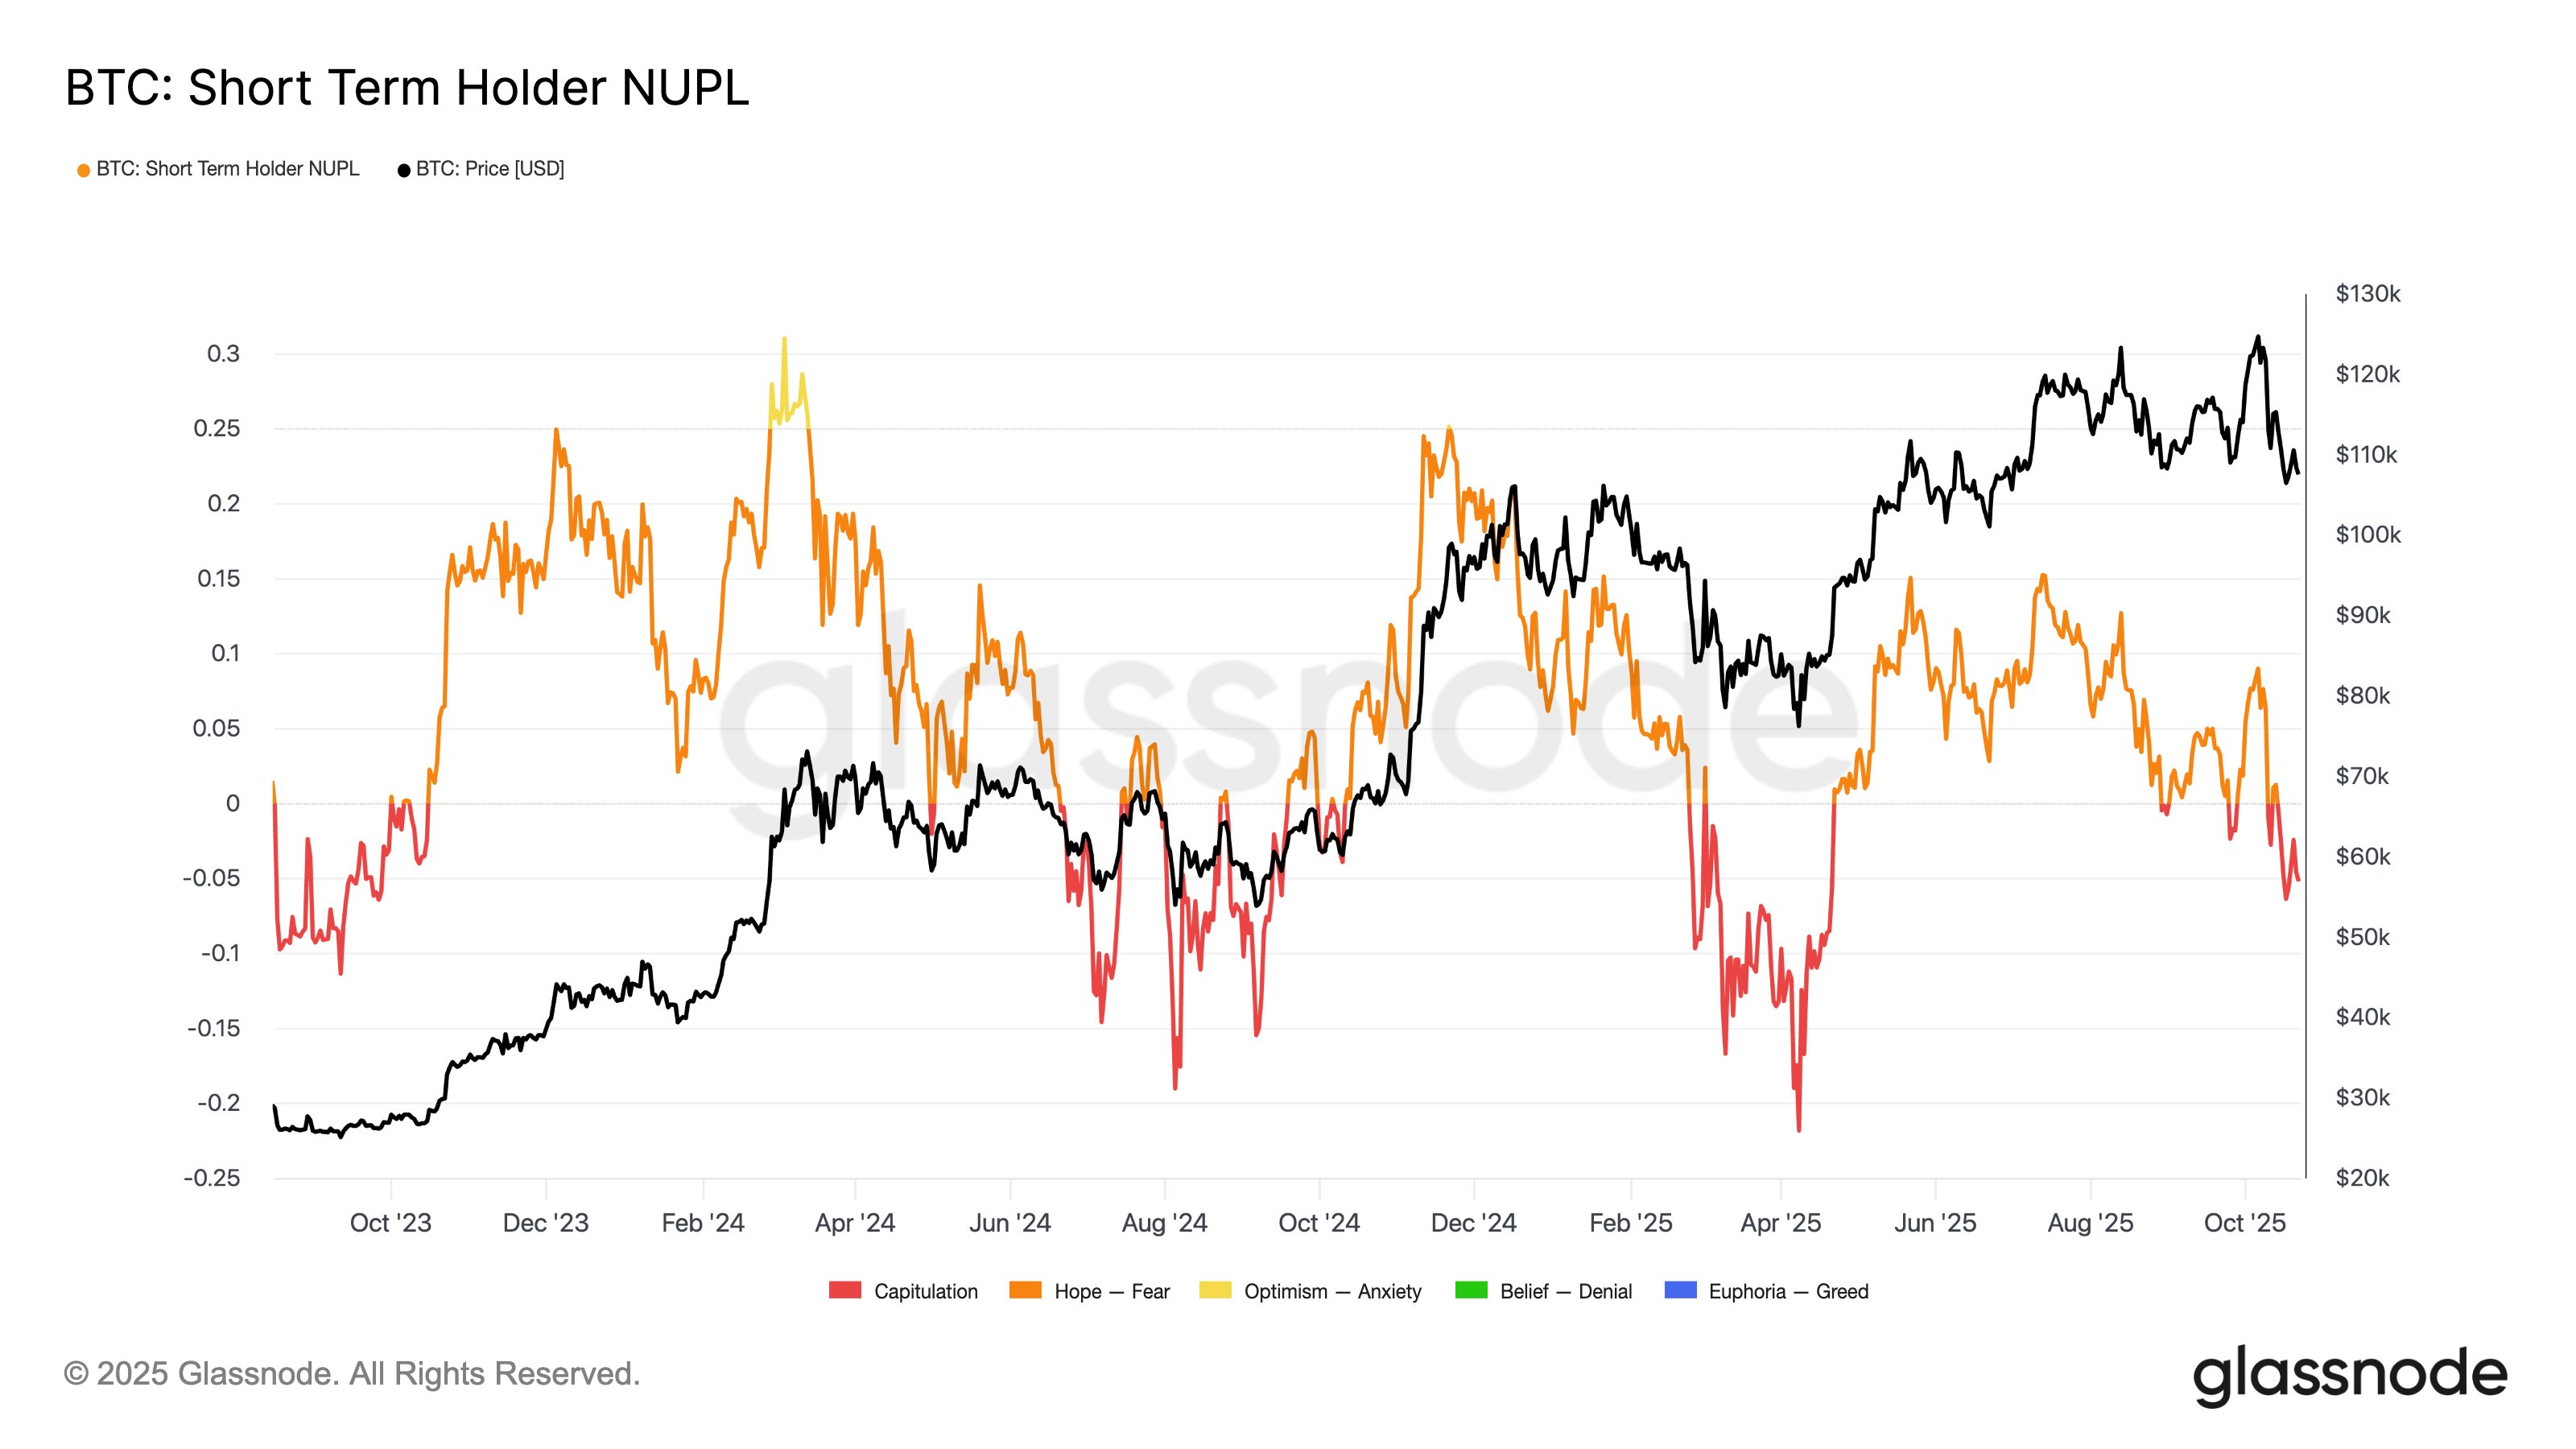
This group is considered to represent the fragile side of the market, prone to making panic moves during times of volatility. With BTC dropping below the cost basis of the cohort, its members are now underwater. “Historically, this structure often precedes the onset of a mid-term bearish phase, as weaker hands begin to capitulate,” noted Glassnode.

In an X post, the analytics firm has shared a chart that puts into perspective the net unrealized loss held by the Bitcoin STHs right now.
Bitcoin STH NUPL

BTC Price

Bitcoin hasn’t been able to sustain a recovery recently as its price is still trading around $109,100.

Bitcoin Price Chart
Disclaimer: The articles reposted on this site are sourced from public platforms and are provided for informational purposes only. They do not necessarily reflect the views of MEXC. All rights remain with the original authors. If you believe any content infringes on third-party rights, please contact [email protected] for removal. MEXC makes no guarantees regarding the accuracy, completeness, or timeliness of the content and is not responsible for any actions taken based on the information provided. The content does not constitute financial, legal, or other professional advice, nor should it be considered a recommendation or endorsement by MEXC.
Share Insights

You May Also Like

‘Love Island Games’ Season 2 Release Schedule—When Do New Episodes Come Out?

‘Love Island Games’ Season 2 Release Schedule—When Do New Episodes Come Out?

The post ‘Love Island Games’ Season 2 Release Schedule—When Do New Episodes Come Out? appeared on BitcoinEthereumNews.com. LOVE ISLAND GAMES — Episode 201 — Pictured: Ariana Madix — (Photo by: Ben Symons/PEACOCK via Getty Images) Ben Symons/PEACOCK via Getty Images We’ve got a text! It’s time for another season of Love Island Games. With fan-favorites returning in hopes of winning the $250,000 cash prize, read on to learn more about Love Island Games Season 2, including the release schedule so you don’t miss a second of drama. Love Island Games is a spinoff in the Love Island franchise that first premiered in 2023. The show follows a similar format to the original series, but with one major twist: all contestants are returning Islanders from previous seasons of Love Island from around the world, including the USA, UK, Australia and more. Another big difference is that games take on much more importance in Love Island Games than the mothership version, with the results “determining advantages, risks, and even who stays and who goes,” according to Peacock. Vanderpump Rules star Ariana Madix is taking over hosting duties for Love Island Games Season 2, replacing Love Island UK star Maya Jama who hosted the first season. Iain Stirling returns as the show’s narrator, while UK alum Maura Higgins will continue to host the Saturday show Love Island: Aftersun. ForbesWho’s In The ‘Love Island Games’ Season 2 Cast? Meet The IslandersBy Monica Mercuri Jack Fowler and Justine Ndiba were named the first-ever winners of Love Island Games in 2023. Justine had previously won Love Island USA Season 2 with Caleb Corprew, while Jack was a contestant on Love Island UK Season 4. In March 2024, Fowler announced on his Instagram story that he and Justine decided to remain “just friends.” The Season 2 premiere revealed the first couples of the season: Andrea Carmona and Charlie Georgios, Andreina Santos-Marte and Tyrique Hyde,…
Share
2025/09/18 04:50