Dogecoin is flashing a rare weekly “bearish cross” just as traders debate whether last week’s $0.08 washout was the cycle’s reset or merely the first leg lower.Dogecoin is flashing a rare weekly “bearish cross” just as traders debate whether last week’s $0.08 washout was the cycle’s reset or merely the first leg lower.

Dogecoin Sees Weekly Bearish Cross: Bottom Or Breakdown Next?

2026/02/17 13:30
3 min read

Dogecoin is flashing a rare weekly “bearish cross” just as traders debate whether last week’s $0.08 washout was the cycle’s reset or merely the first leg lower. The setup matters beyond DOGE itself because memecoin flows are increasingly being treated as a proxy for risk appetite across crypto.

Is The Dogecoin Bottom In?

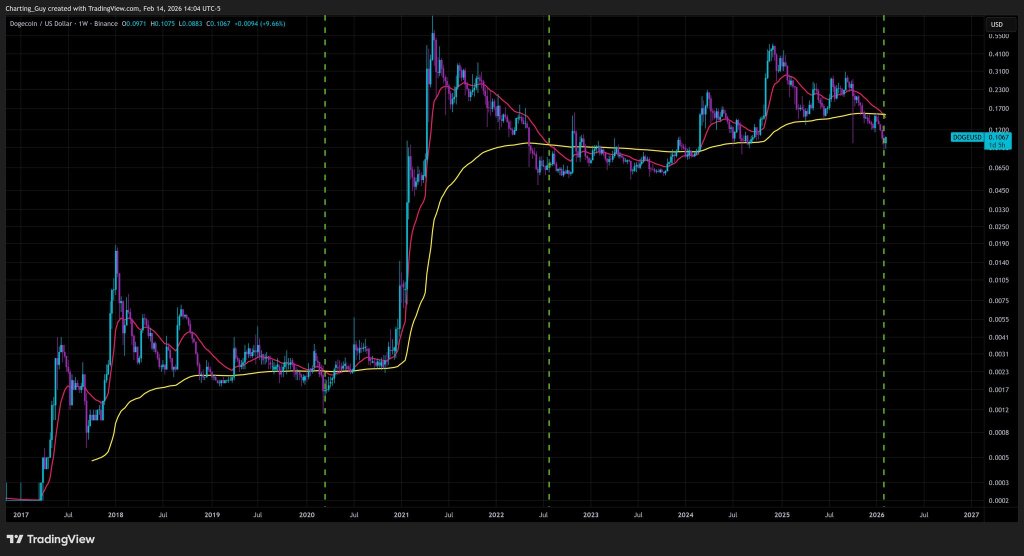
A chart shared by Charting Guy shows the 20-week EMA crossing below the 200-week EMA, a technical event he argues has historically aligned with DOGE capitulation. “DOGE typically bottoms around when the 20 weekly EMA crosses below the 200 weekly EMA. That happened last week” he wrote, adding that he “increased my position by 50% at the lows” and that his community received buy alerts.

Dogecoin weekly bearish cross

That framing is colliding with more cautious range-based reads from other analysts watching spot structure instead of the moving-average signal alone.

Daan Crypto Trades described the post-dip bounce as constructive, but explicitly framed it as range trade rather than trend confirmation. “DOGE Decent price action here over the past few days after the big $0.08 test last week. Currently seeing this $0.08-$0.13 area as a large range,” he posted.

“Anything above that point would make me confident in a further move towards the Daily 200MA/EMA. Currently near the middle so hard to really assume a direction here the way it’s trading.”

Dogecoin price analysis

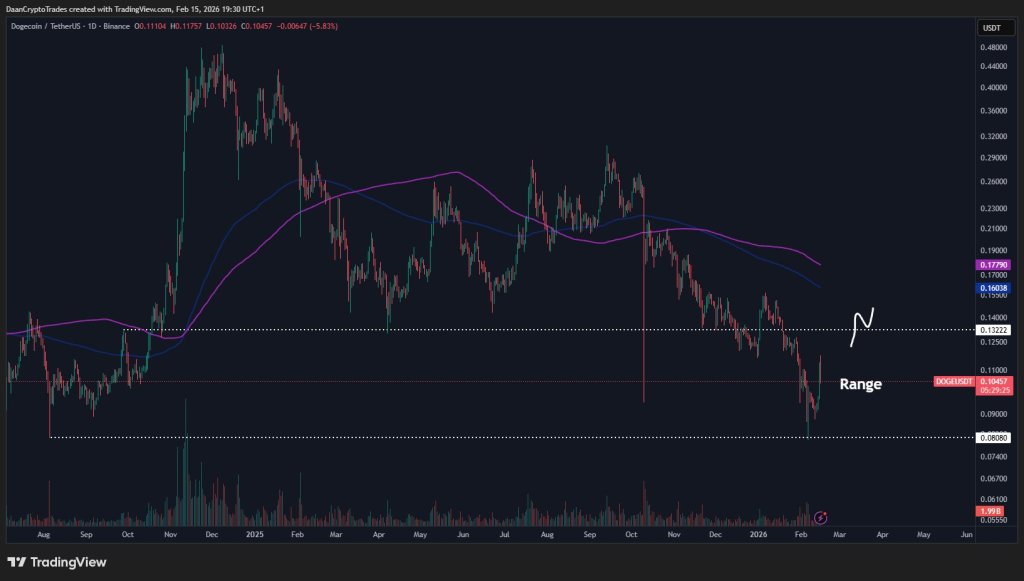
On his chart, DOGE/USDT was sitting around the middle of that band near $0.10–$0.11, with the upper range marker around $0.132 and the lower boundary near $0.088. In other words: not a clean trend, not a clean mean reversion, just a market waiting for a push.

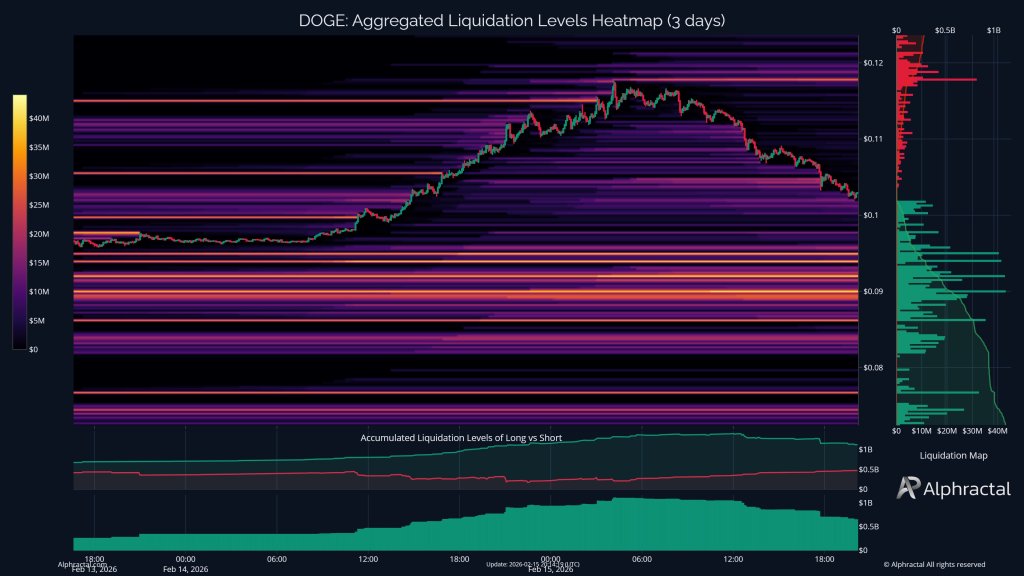
That “waiting” can be expensive in a leverage-heavy coin. CEO of Aphractal João Wedson struck a stark tone, warning: “If you are long on Doge, you will likely be liquidated soon!”

An aggregated liquidation heatmap shared by Alphractal highlights why this warning resonates with derivatives traders: thick bands of potential liquidation levels sit below current price over the past three days, suggesting stop-driven moves could cascade if DOGE starts trending instead of chopping.

Dogecoin liquidation heatmap

Wedson also argued that DOGE rallies can function as a broader volatility tell for Bitcoin, calling them “a risk signal for Bitcoin” and saying it “usually happens when Bitcoin is moving sideways.”

Alphractal echoed the rotation narrative in a longer note on flows. “Over the past few days, memecoins have significantly outperformed BTC and other altcoins. What stood out the most was Dogecoin, where the number of trades surpassed all others in its category,” the account wrote. “However, in the last few hours, memecoins have started to correct while BTC remains relatively stable.”

The near-term map is clean even if the conviction isn’t. Bulls need a decisive reclaim of the top of the $0.08–$0.13 range to credibly reopen the path toward the daily 200 MA/EMA that Daan flagged. Bears, meanwhile, will focus on whether the market revisits the $0.08 area and whether that level holds on a second test with liquidation clusters in play.

At press time, Dogecoin traded at $0.10.

Dogecoin price chart
Market Opportunity
DOGE Logo
DOGE Price(DOGE)
$0,10193
$0,10193$0,10193
+1,44%
USD
DOGE (DOGE) Live Price Chart
Disclaimer: The articles reposted on this site are sourced from public platforms and are provided for informational purposes only. They do not necessarily reflect the views of MEXC. All rights remain with the original authors. If you believe any content infringes on third-party rights, please contact [email protected] for removal. MEXC makes no guarantees regarding the accuracy, completeness, or timeliness of the content and is not responsible for any actions taken based on the information provided. The content does not constitute financial, legal, or other professional advice, nor should it be considered a recommendation or endorsement by MEXC.

You May Also Like

The DDC Group and MindMap Digital Announce Strategic Partnership

The DDC Group and MindMap Digital Announce Strategic Partnership

AI-led BPM, The DDC Group, and AI Architects, MindMap Digital Partner to Accelerate a New Era of F&A. EVERGREEN, Colo., Feb. 17, 2026 /PRNewswire/ — The DDC Group
Share
AI Journal2026/02/17 23:32
Bitcoin 8% Gains Already Make September 2025 Its Second Best

Bitcoin 8% Gains Already Make September 2025 Its Second Best

The post Bitcoin 8% Gains Already Make September 2025 Its Second Best appeared on BitcoinEthereumNews.com. Key points: Bitcoin is bucking seasonality trends by adding 8%, making this September its best since 2012. September 2025 would need to see 20% upside to become Bitcoin’s strongest ever. BTC price volatility is at levels rarely seen before in an unusual bull cycle. Bitcoin (BTC) has gained more this September than any year since 2012, a new bull market record. Historical price data from CoinGlass and BiTBO confirms that at 8%, Bitcoin’s September 2025 upside is its second-best ever. Bitcoin avoiding “Rektember” with 8% gains September is traditionally Bitcoin’s weakest month, with average losses of around 8%. BTC/USD monthly returns (screenshot). Source: CoinGlass This year, the stakes are high for BTC price seasonality, as historical patterns demand the next bull market peak and other risk assets set repeated new all-time highs. While both gold and the S&P 500 are in price discovery, BTC/USD has coiled throughout September after setting new highs of its own the month prior. Even at “just” 8%, however, this September’s performance is currently enough to make it Bitcoin’s strongest in 13 years. The only time that the ninth month of the year was more profitable for Bitcoin bulls was in 2012, when BTC/USD gained about 19.8%. Last year, upside topped out at 7.3%. BTC/USD monthly returns. Source: BiTBO BTC price volatility vanishes The figures underscore a highly unusual bull market peak year for Bitcoin. Related: BTC ‘pricing in’ what’s coming: 5 things to know in Bitcoin this week Unlike previous bull markets, BTC price volatility has died off in 2025, against the expectations of longtime market participants based on prior performance. CoinGlass data shows volatility dropping to levels not seen in over a decade, with a particularly sharp drop from April onward. Bitcoin historical volatility (screenshot). Source: CoinGlass Onchain analytics firm Glassnode, meanwhile, highlights the…
Share
BitcoinEthereumNews2025/09/18 11:09
The Economics of Self-Isolation: A Game-Theoretic Analysis of Contagion in a Free Economy

The Economics of Self-Isolation: A Game-Theoretic Analysis of Contagion in a Free Economy

Exploring how the costs of a pandemic can lead to a self-enforcing lockdown in a networked economy, analyzing the resulting changes in network structure and the existence of stable equilibria.
Share
Hackernoon2025/09/17 23:00