Aster Price Prediction: Can ASTER Rally to $1.08 in 2026?
This article was first published on The Bit Journal.
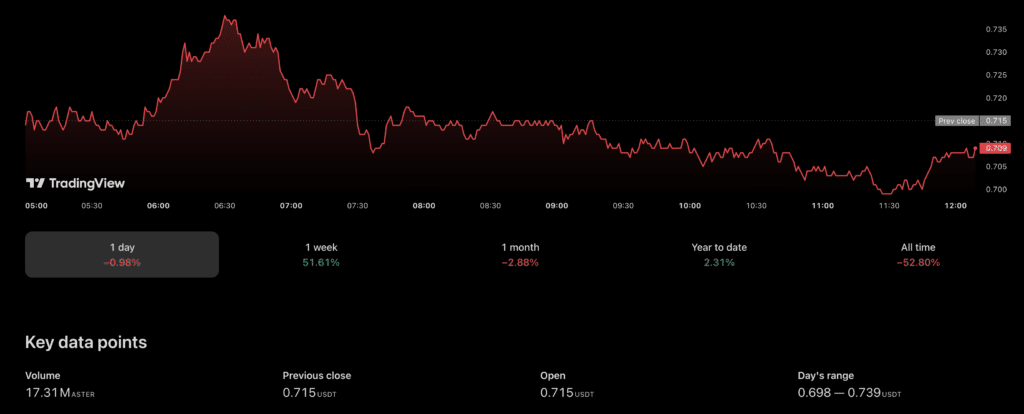
Aster price prediction discussions are heating up as Aster price today hovers around $0.699203, putting the token at a major technical crossroads. With 24-hour trading volume near $247 million and a market cap above $1.73 billion, ASTER is no longer flying under the radar. According to data tracked on CoinMarketCap, this asset is showing early signs of structural maturity, even as short-term volatility remains high.
This Aster price prediction report compares bullish breakout scenarios with downside pullback risks. By blending Aster technical analysis, volume trends, and market psychology, this article explores whether the long-awaited surge to $1.08 is realistic or if a painful retracement lies ahead.
Market Snapshot: Understanding Aster Price Today and On-Chain Activity
Aster price today reflects a market that is cautiously optimistic. Trading near $0.70, ASTER is up roughly 0.54% over the past 24 hours, suggesting modest accumulation rather than euphoric buying. Circulating supply currently stands at approximately 2.47 billion tokens, while the maximum supply remains capped at 8 billion, shaping long-term valuation expectations.
From an Aster crypto price analysis perspective, liquidity is healthy, and spreads remain tight across major exchanges. This indicates institutional and retail participation is expanding. Aster price prediction models increasingly factor in stable turnover and improving order book depth. Meanwhile, rising derivatives activity suggests traders are positioning ahead of a possible trend reversal. These dynamics make Aster price today a key reference point for short-term and mid-term investors.
 Aster Price Prediction: Can ASTER Rally to $1.08 in 2026? 2
Technical Structure: Aster Technical Analysis and Key Resistance Levels
Aster technical analysis shows the token trading within a well-defined consolidation channel. The immediate Aster resistance level sits between $0.74 and $0.78, where sellers previously defended aggressively. A confirmed breakout above this range would strengthen the Aster bullish breakout narrative and validate higher price targets.
On the downside, the Aster support zone near $0.62 to $0.65 remains critical. Losing this region could trigger algorithmic selling and open the door to a deeper pullback scenario. Chart indicators, including moving averages and momentum oscillators, suggest neutral-to-bullish conditions. However, volume confirmation remains essential. In Aster price prediction today frameworks, resistance behavior often determines whether rallies become sustainable trends or short-lived spikes.
Volume and Open Interest: What Smart Money Is Signaling
Aster volume analysis highlights a steady rise in spot and derivatives participation. Average daily volume exceeding $200 million signals strong speculative and hedging interest. At the same time, Aster open interest has expanded, reflecting growing confidence among leveraged traders.
From an Aster momentum analysis standpoint, rising open interest paired with stable funding rates usually points to organic demand rather than reckless speculation. This strengthens the Aster crypto outlook in the short term. However, excessive leverage remains a structural risk. Aster price prediction models warn that sudden liquidations could amplify volatility. For traders asking, “Is Aster a good investment now,” monitoring volume and derivatives positioning remains essential.
Bullish Case: Can Aster Reach the $1.08 Price Target?
The bullish Aster market prediction centers on a confirmed breakout above multi-month resistance. If ASTER clears $0.80 with strong volume, the psychological path toward the Aster price target 1.08 becomes realistic. Historical fractals show similar consolidation patterns leading to 40% to 60% rallies.
Catalysts could include ecosystem expansion, exchange integrations, and broader market recovery. Aster price after breakout scenarios project acceleration driven by momentum traders and long-term holders. In many Aster price prediction today simulations, $1.08 represents the first major extension target before profit-taking intensifies. For investors wondering, “Will Aster reach $1.08 in 2026,” sustained adoption and liquidity growth remain decisive factors.
Bearish Case: Mapping the Painful Pullback Scenario
Despite improving fundamentals, downside risks remain real. The Aster pullback scenario becomes more likely if price fails repeatedly near resistance. Weak macro sentiment, declining risk appetite, or regulatory pressure could also weigh on performance.
From an Aster breakout prediction perspective, false breakouts are particularly dangerous. A rejection near $0.75 could push ASTER back toward the $0.60 region, eroding trader confidence. Aster price forecast models show that breakdowns below major moving averages often lead to extended consolidation. This highlights why disciplined risk management is critical. Aster price prediction frameworks consistently stress that pullbacks are part of healthy market cycles, not necessarily signs of long-term failure.
Comparative Outlook: Aster Versus Broader Market Trends
Compared to mid-cap peers, ASTER displays relatively stable liquidity and moderate volatility. While meme tokens and micro-caps experience extreme swings, Aster price today reflects more structured trading behavior. This positions ASTER closer to infrastructure-focused projects rather than speculative hype assets.
In Aster crypto outlook comparisons, its market cap-to-volume ratio suggests balanced participation. Meanwhile, correlations with major digital assets remain moderate, offering partial diversification benefits. Aster market prediction studies indicate that assets with similar profiles often outperform during recovery phases. For analysts conducting Aster breakout or pullback analysis, relative strength against peers remains a strong bullish indicator.
Trading Strategy: Practical Setup for Short-Term and Long-Term Players
An effective Aster trading setup blends technical levels with sentiment tracking. Short-term traders often focus on breakout confirmation above $0.78, with stop-loss placement near $0.70. Long-term participants typically accumulate near the Aster support zone, aiming for multi-month appreciation.
Aster short-term forecast models emphasize patience. Chasing green candles without volume confirmation often leads to losses. For those researching Aster trading strategy for beginners, simplicity matters. Trend-following approaches aligned with Aster technical analysis February 2026 projections appear more reliable than aggressive scalping. Across most Aster price prediction today frameworks, disciplined entries and exits outperform emotional decisions.
Long-Term Perspectives: Will Aster Reach $1.08 in 2026?
A key question around the Aster price prediction centers on its long-term prospects: Will Aster reach $1.08 in 2026? While short-term swings offer insight, long-term price performance depends on adoption, ecosystem development, and macro trends. Reaching and sustaining levels near $1.08 requires consistent network activity, liquidity inflows, and broader market tailwinds.
This longer lens position helps contextualize the immediate chart action and situates Aster crypto outlook within multi-month cycles that define major bull and bear phases. Traders with patient horizons may find this perspective instrumental in shaping expectations.
 Aster Price Prediction: Can ASTER Rally to $1.08 in 2026? 3
Risk Factors and Regulatory Considerations
Every Aster price prediction must account for systemic risks. Market-wide sell-offs, exchange outages, and regulatory shifts can disrupt even strong technical setups. Token supply dynamics also matter, as future unlocks may increase circulating pressure.
Security concerns, smart contract vulnerabilities, and governance disputes could undermine investor trust. Aster crypto price analysis increasingly integrates risk premiums to reflect these uncertainties. While current indicators favor stability, no digital asset is immune to sudden shocks. Investors evaluating “Is Aster a good investment now” should balance growth potential with downside exposure.
Conclusion: Breakout Dream or Reality Check?
Aster price prediction remains finely balanced between optimism and caution. Aster price today near $0.70 reflects growing confidence without speculative excess. Technical structure supports a potential move toward the Aster price target 1.08, provided resistance breaks with conviction. At the same time, the Aster pullback scenario cannot be ignored if momentum weakens.
For traders and investors, the message is clear: follow the data, respect key levels, and avoid emotional decisions. Continuous monitoring of Aster support and resistance levels today will determine whether ASTER delivers an explosive rally or a sobering correction. Stay informed, apply disciplined strategies, and revisit Aster price prediction models regularly before making capital commitments.
Frequently Asked Questions About Aster Price Prediction
What is the latest Aster price today?
Aster is trading around $0.70 USD, with steady market activity and moderate volatility.
Will Aster reach $1.08 in 2026?
It could, if bullish momentum and market conditions hold, but risks remain.
Is Aster a good investment now?
Potential upside exists, but investors should consider volatility and resistance levels.
What are the key support and resistance levels for Aster?
Support is near recent lows, while major resistance sits around $1.08.
What is the best Aster trading strategy for beginners?
Focus on support zones, stop-losses, and breakout confirmation before entering trades.
Appendix: Glossary of Key Terms
Resistance Level: A price zone where selling pressure tends to limit upward movement.
Support Zone: A price area where buying demand historically prevents further declines.
Open Interest: The total number of outstanding derivative contracts.
Market Cap: Total value of circulating tokens multiplied by price.
Liquidity: The ease with which an asset can be traded without affecting price.
References
Coincodex
tradingview
CoinMarketCap – ASTER
Disclaimer
This article is for informational and educational purposes only and does not constitute financial, investment, or legal advice. Cryptocurrency prices are highly volatile, and investing in digital assets involves significant risk. Always conduct independent research and consult a qualified financial advisor before making investment decisions.
Read More: Aster Price Prediction: Can ASTER Rally to $1.08 in 2026?">Aster Price Prediction: Can ASTER Rally to $1.08 in 2026?
You May Also Like

Microsoft Corp. $MSFT blue box area offers a buying opportunity

TON Technical Analysis Feb 14