

Dogecoin Price Slips Below $0.10 as Selling Pressure Intensifies, Despite Musk Hints

The post Dogecoin Price Slips Below $0.10 as Selling Pressure Intensifies, Despite Musk Hints appeared first on Coinpedia Fintech News
Dogecoin price slid sharply nearly 7% intraday and dipped below the key $0.10 support zone amid broader market weakness. The decline comes despite renewed “moon mission” chatter linked to Elon Musk’s recent social media interaction, showing that the meme coin’s traditional narrative drivers may be losing momentum in the current macro environment. While DOGE did briefly react to Musk-related posts earlier in the week, the response has so far failed to sustain a bullish trend, leaving price vulnerable as sellers remain in control.
Narrative Fizzles: Musk Moon Comments Barely Move DOGE Price
Elon Musk’s recent reply on X, hinting that SpaceX “maybe next year” could support the long-delayed DOGE-1 lunar mission sparked modest interest in Dogecoin, with markets initially posting gains. However, the hype was short-lived. Unlike past cycles where similar comments triggered extended rallies, DOGE’s bounce lacked follow-through and quickly gave way to renewed selling.
This suggests that narrative catalysts alone are not carrying the same market influence they once did, especially when broader crypto sentiment is under pressure.
ETF Flows Lose Momentum as DOGE Price Fails to Respond
Dogecoin spot ETF data paints a mixed picture rather than a bullish one. During early January, DOGE ETFs recorded a weekly net inflow of roughly $252K, followed by additional single-day inflows near $1.9M–$2.6M in subsequent sessions. These spikes briefly lifted cumulative inflows to around $6.7M, while total net assets hovered near $9.3M.
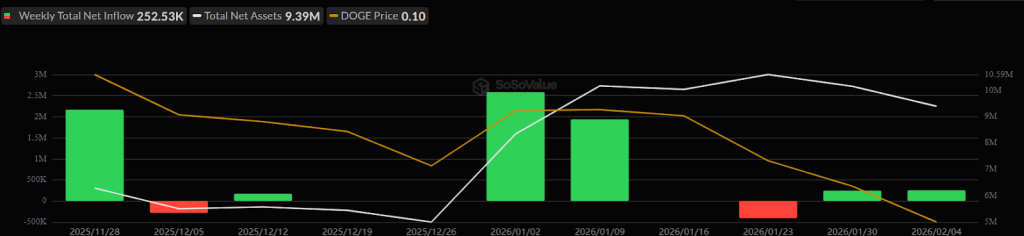
However, these inflows failed to persist. Several sessions quickly flipped back into net outflows, highlighting a lack of sustained institutional conviction. Trading volumes also remained uneven, suggesting that most activity was reactive rather than trend-driven. In short, ETF participation exists but it is tactical, not directional. Without consistent inflows, DOGE has struggled to find a structural bid.
Dogecoin Price Analysis: What the Chart is Really Saying
Dogecoin price has been trading inside a well-defined descending channel, but the latest move is critical, as DOGE price has fallen toward the support trendline that had held since the previous consolidation phase. This drop shifts near-term control firmly toward sellers. Recent rallies are getting cut short earlier, while drops are stretching deeper than before. Each recovery attempt loses momentum near the same zone, while downside moves travel further. At press time, DOGE price trades at $0.098, below the short-term moving averages, underlying weakness.
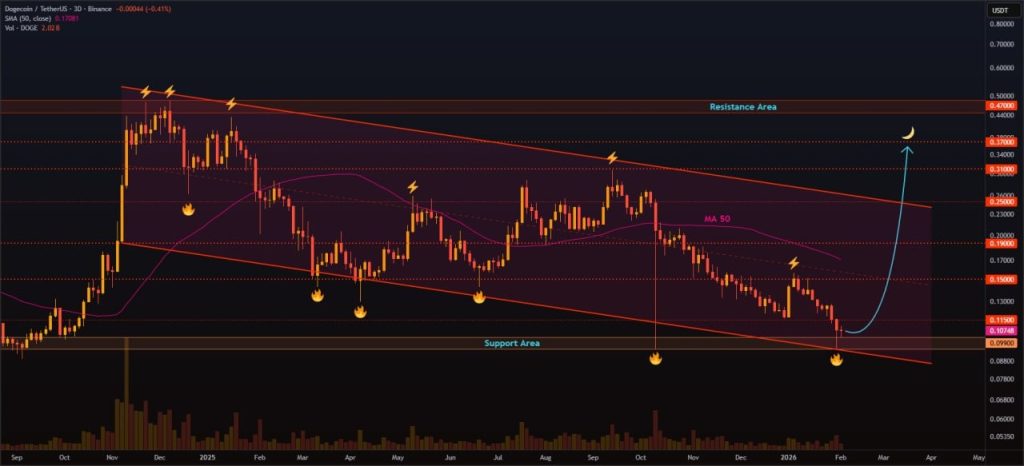
On the downside, the $0.098–$0.095 zone now stands out as the first major support. A daily close below $0.095 would expose DOGE to a deeper pullback toward the $0.088–$0.090 range, which represents the channel base and a historically reactive level. On the upside, immediate resistance sits near $0.105–$0.108, where price was repeatedly rejected after the breakdown. Above that, the more decisive level remains $0.118–$0.120, coinciding with the descending channel’s midline. Until DOGE reclaims this zone with volume expansion, rebounds are likely to remain corrective rather than trend-reversing.
Liquidation Heatmap Shows Heavy Pressure Below $0.10
Liquidation data shows that Dogecoin has already swept most downside liquidity following the recent sell-off, reducing the immediate incentive for price to push sharply lower from current levels. As DOGE dipped below the $0.10 zone, clusters of long liquidations were largely cleared, easing near-term downside pressure. Now, attention is shifting to overhead liquidity, where dense clusters are building between $0.129 and $0.132. These levels mark areas where a large concentration of short positions remains exposed. If price begins to grind higher and approaches this zone, it could trigger forced short covering, potentially accelerating upside momentum.
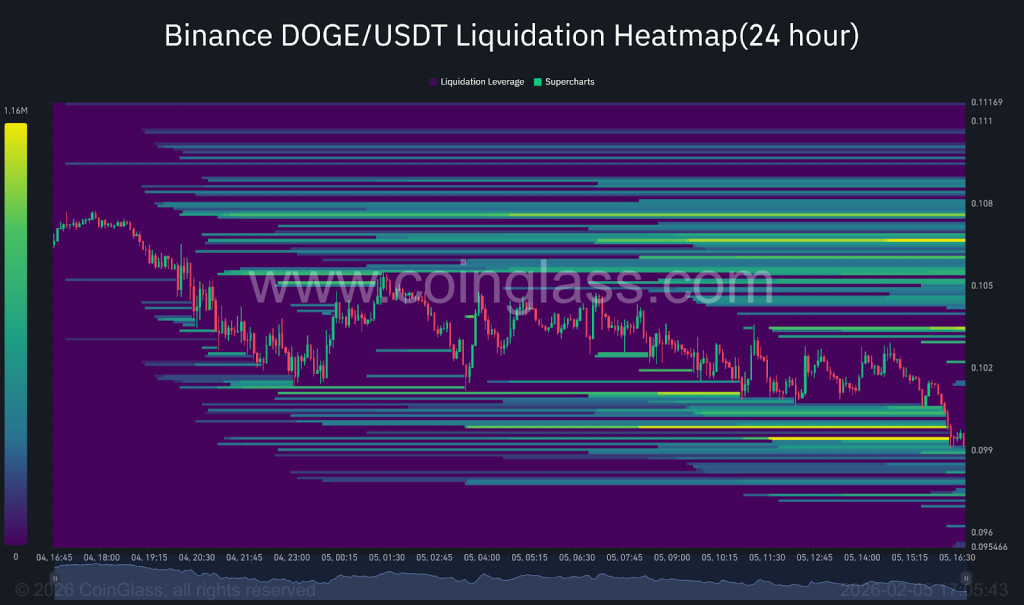
Notably, this setup reflects a market driven more by liquidity positioning than organic spot demand. Traders are watching whether DOGE can attract enough buying pressure to move into these liquidity pockets. Without follow-through, price risks remaining range-bound. However, a decisive push toward these levels could quickly change market dynamics, turning a slow recovery into a sharper liquidity-driven move.
You May Also Like

nLIGHT to Announce Fourth Quarter and Full Year 2025 Financial Results on February 26th
When silver became a meme stock, retail investors ultimately caught the falling knife.
