The crypto market took a sharp turn lower this week as a cocktail of weak economic data and heavy profit-taking sparked a wave of selling.The crypto market took a sharp turn lower this week as a cocktail of weak economic data and heavy profit-taking sparked a wave of selling.

Bitcoin and the crypto market are in the red today, here’s why

3 min read

The crypto market took a sharp turn lower this week as a cocktail of weak economic data, renewed trade tensions, and heavy profit-taking sparked a wave of selling across Bitcoin and major altcoins.

Summary
  • The crypto market continued crashing, with the market cap falling to $3.6 trillion. 
  • This crash happened after the weak nonfarm payrolls report on Friday.
  • Forced liquidations have jumped to over $1.5 billion in the last two days.

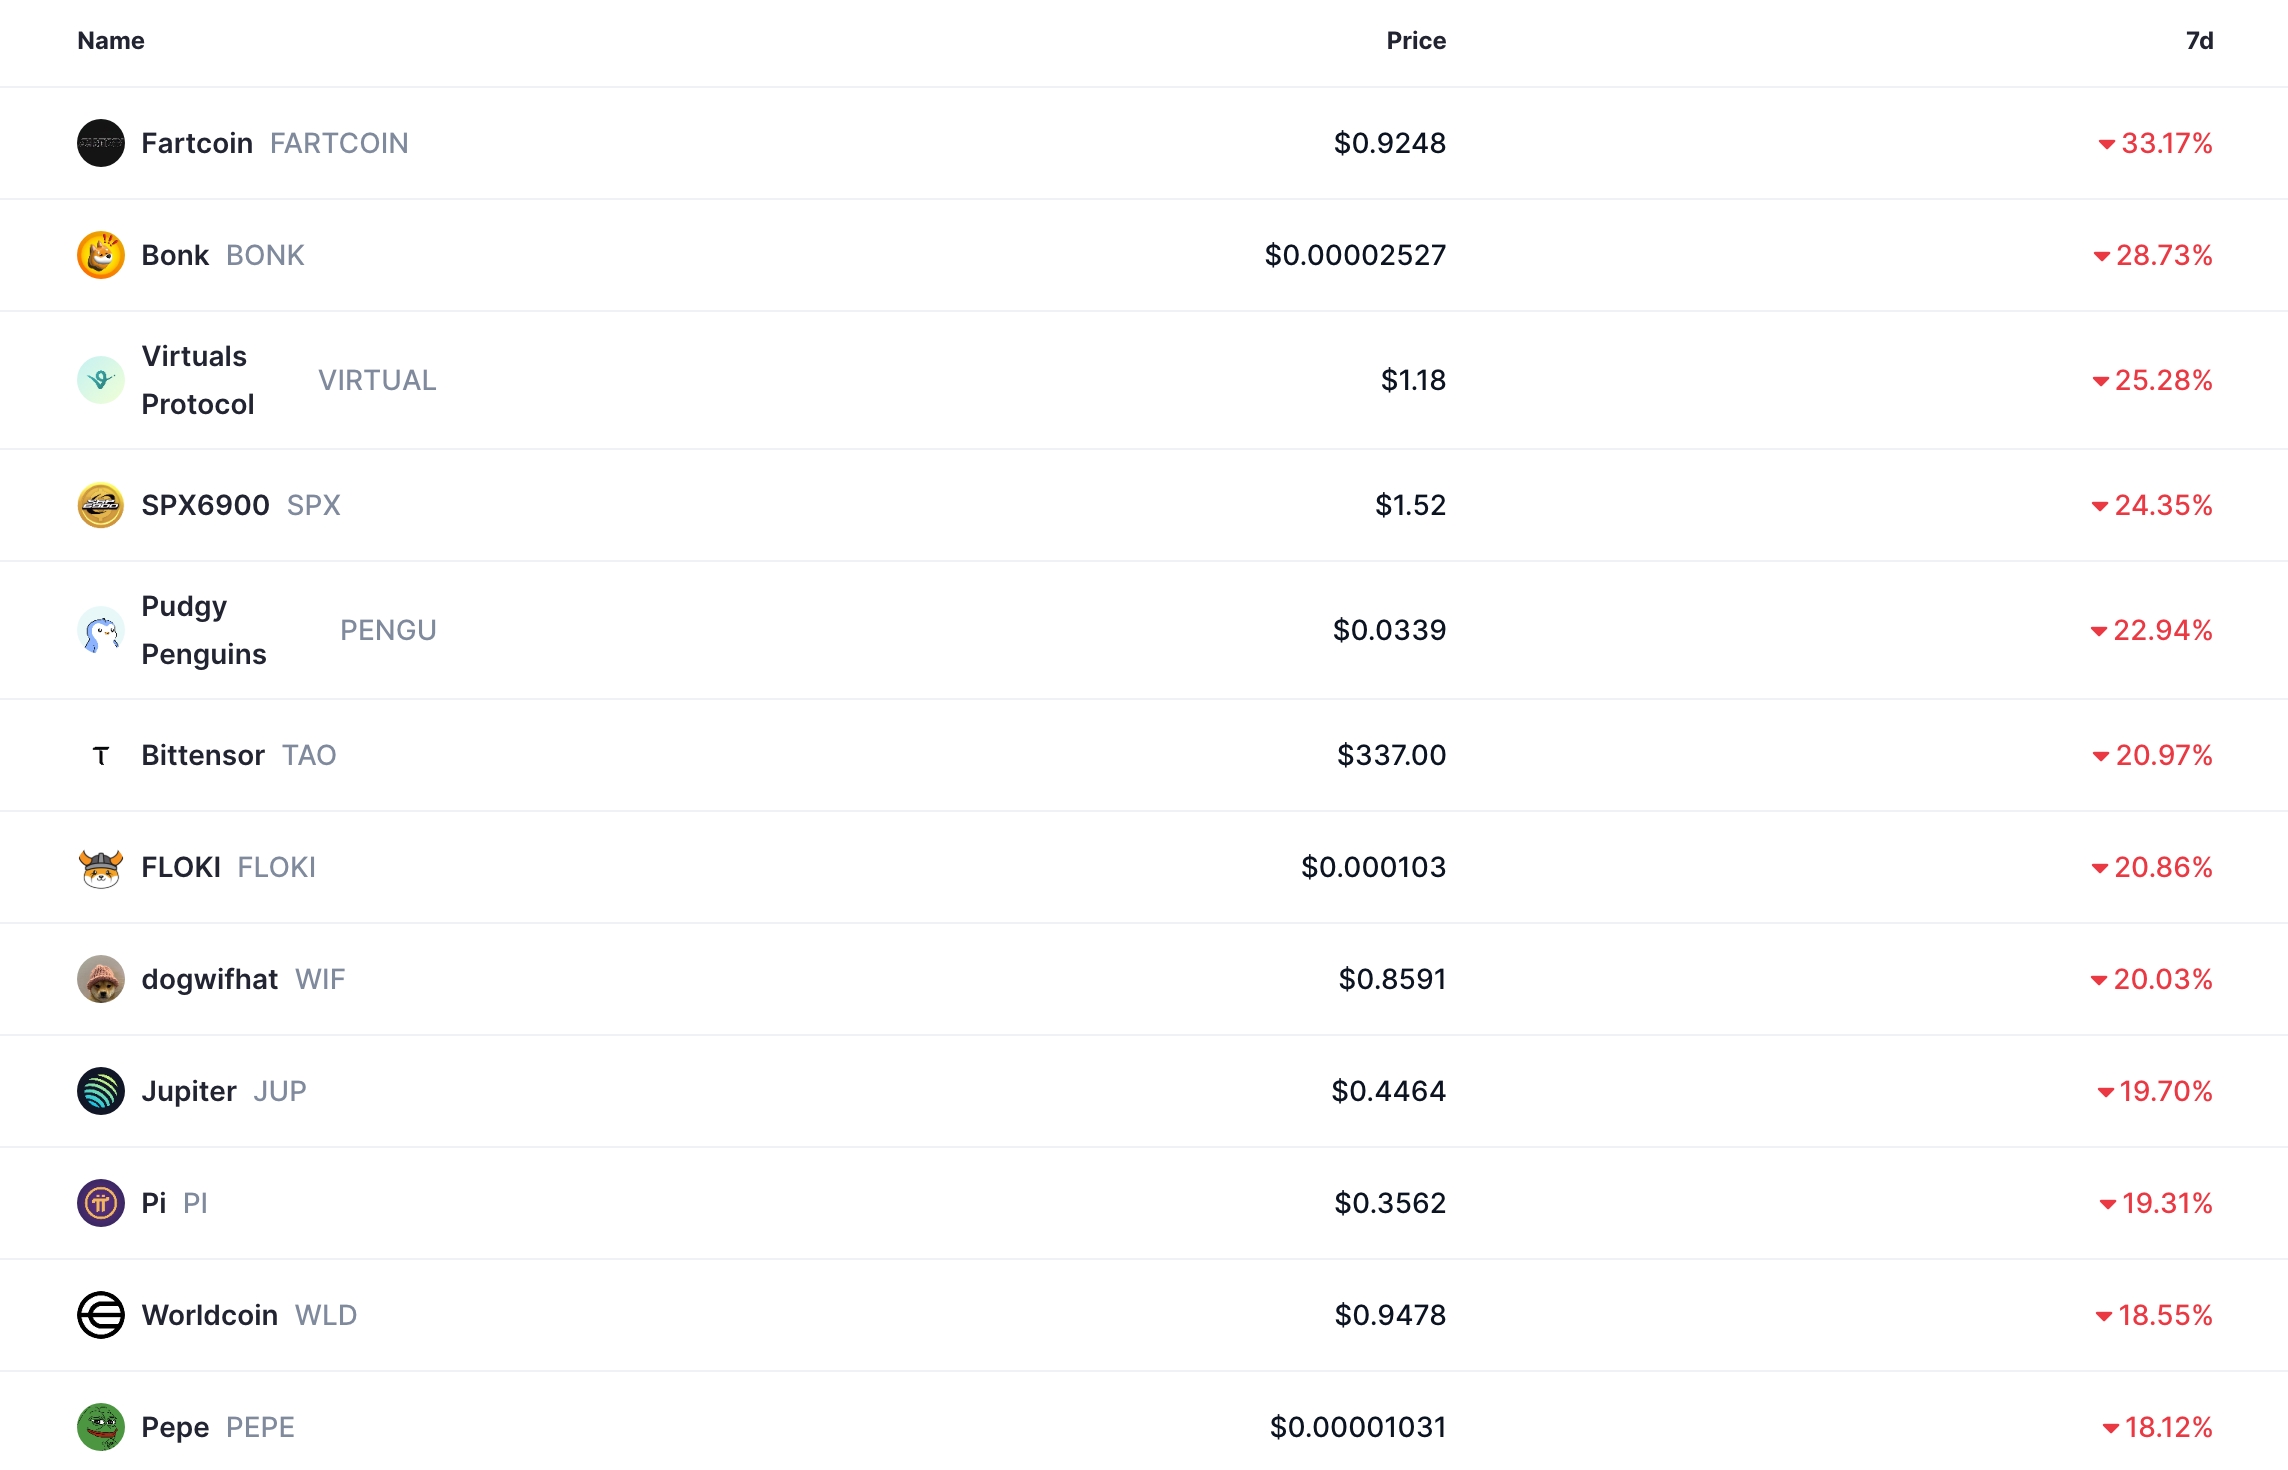
Bitcoin (BTC) dropped from a record high of $123,200 in July to $112,107 at last check Saturday, while top altcoins like Pi Network (PI), Ethena (ENA), Conflux (CFX), and Fartcoin (FARTCOIN) have moved into a bear market after falling by over 10% from their July highs.

The worst performing cryptocurrencies in the last seven days

Weak NFP data and data chief firing

The crypto market crashed after the US published weak nonfarm payrolls data on Friday. A report showed that the economy created just 73,000 jobs in July, while the jobless rate rose to 4.2%. 

Worse, the agency revised down the prior two months’ job additions by 260,000, meaning that the employment growth in the last three months averaged just 35,000, the worst level since the pandemic. 

In a TruthSocial post, President Donald Trump lamented that the jobs numbers were “rigged” to make him and Republicans look bad. He then went ahead and fired Dr. Erika McEntarfer as the Commissioner of Labor Statistics.

Therefore, the crypto market dropped as investors remained concerned about the accuracy of US data, which help the Fed when delivering its interest rate decisions. 

Crypto Market also crashed as the trade war intensified

The crypto market also continued to rally amid concerns about Trump’s trade war. He implemented tariffs on key trading partners, including India, South Africa, and Switzerland. 

While the US has reached agreements with partners such as Japan, the European Union, and South Korea, it has maintained a base rate of 15%. These tariffs could contribute to the slowdown of the US economy, as this week’s jobs data showed. This also explains why the stock market crashed on Friday, with the Dow Jones and Nasdaq 100 falling by over 600 points. 

Profit taking after a strong rally

Finally, the crypto market is crashing amid profit-taking and forced liquidations among market participants. 

It is common for traders and investors to take profits after a strong surge in the stock or crypto market. This explains why Bitcoin and altcoins regularly pull back after a strong surge.

For example, Bitcoin has historically moved into either a correction or a bear market after reaching a record high. Most recently, it dropped by 12% after soaring to a record high in May. It also dropped from an all-time high of $109,238 in January to a low of $74,500 in April.

The cryptocurrency market is also experiencing a decline of forced liquidations, which leads to more selling pressure. Over $900 million worth of cryptocurrencies was liquidated on Friday, followed by $600 million on Saturday, according to CoinGlass.

Market Opportunity
RedStone Logo
RedStone Price(RED)
$0,2132
$0,2132$0,2132
-0,92%
USD
RedStone (RED) Live Price Chart
Disclaimer: The articles reposted on this site are sourced from public platforms and are provided for informational purposes only. They do not necessarily reflect the views of MEXC. All rights remain with the original authors. If you believe any content infringes on third-party rights, please contact [email protected] for removal. MEXC makes no guarantees regarding the accuracy, completeness, or timeliness of the content and is not responsible for any actions taken based on the information provided. The content does not constitute financial, legal, or other professional advice, nor should it be considered a recommendation or endorsement by MEXC.

You May Also Like

Egrag Crypto: XRP Could be Around $6 or $7 by Mid-November Based on this Analysis

Egrag Crypto: XRP Could be Around $6 or $7 by Mid-November Based on this Analysis

Egrag Crypto forecasts XRP reaching $6 to $7 by November. Fractal pattern analysis suggests a significant XRP price surge soon. XRP poised for potential growth based on historical price patterns. The cryptocurrency community is abuzz after renowned analyst Egrag Crypto shared an analysis suggesting that XRP could reach $6 to $7 by mid-November. This prediction is based on the study of a fractal pattern observed in XRP’s past price movements, which the analyst believes is likely to repeat itself in the coming months. According to Egrag Crypto, the analysis hinges on fractal patterns, which are used in technical analysis to identify recurring market behavior. Using the past price charts of XRP, the expert has found a certain fractal that looks similar to the existing market structure. The trend indicates that XRP will soon experience a great increase in price, and the asset will probably reach the $6 or $7 range in mid-November. The chart shared by Egrag Crypto points to a rising trend line with several Fibonacci levels pointing to key support and resistance zones. This technical structure, along with the fractal pattern, is the foundation of the price forecast. As XRP continues to follow the predicted trajectory, the analyst sees a strong possibility of it reaching new highs, especially if the fractal behaves as expected. Also Read: Why XRP Price Remains Stagnant Despite Fed Rate Cut #XRP – A Potential Similar Set-Up! I've been analyzing the yellow fractal from a previous setup and trying to fit it into various formations. Based on the fractal formation analysis, it suggests that by mid-November, #XRP could be around $6 to $7! Fractals can indeed be… pic.twitter.com/HmIlK77Lrr — EGRAG CRYPTO (@egragcrypto) September 18, 2025 Fractal Analysis: The Key to XRP’s Potential Surge Fractals are a popular tool for market analysis, as they can reveal trends and potential price movements by identifying patterns in historical data. Egrag Crypto’s focus on a yellow fractal pattern in XRP’s price charts is central to the current forecast. Having contrasted the market scenario at the current period and how it was at an earlier time, the analyst has indicated that XRP might revert to the same price scenario that occurred at a later cycle in the past. Egrag Crypto’s forecast of $6 to $7 is based not just on the fractal pattern but also on broader market trends and technical indicators. The Fibonacci retracements and extensions will also give more insight into the price levels that are likely to be experienced in the coming few weeks. With mid-November in sight, XRP investors and traders will be keeping a close eye on the market to see if Egrag Crypto’s analysis is true. If the price targets are reached, XRP could experience one of its most significant rallies in recent history. Also Read: Top Investor Issues Advance Warning to XRP Holders – Beware of this Risk The post Egrag Crypto: XRP Could be Around $6 or $7 by Mid-November Based on this Analysis appeared first on 36Crypto.
Share
Coinstats2025/09/18 18:36
‘High Risk’ Projects Dominate Crypto Press Releases, Report Finds

‘High Risk’ Projects Dominate Crypto Press Releases, Report Finds

The post ‘High Risk’ Projects Dominate Crypto Press Releases, Report Finds appeared on BitcoinEthereumNews.com. More than six in 10 crypto press releases published
Share
BitcoinEthereumNews2026/02/04 13:09
Why Vitalik Says L2s Aren’t Ethereum Shards Now?

Why Vitalik Says L2s Aren’t Ethereum Shards Now?

The post Why Vitalik Says L2s Aren’t Ethereum Shards Now? appeared on BitcoinEthereumNews.com. Vitalik says Ethereum’s scaling and higher gas limits mean L2s no
Share
BitcoinEthereumNews2026/02/04 13:18