Ethereum’s price jumped for six consecutive days, reaching its highest point since January 7. It has jumped by over 158% from its lowest point in May this year. Ethereum (ETH) jumped to around $3,580, making it one of the best-performing…Ethereum’s price jumped for six consecutive days, reaching its highest point since January 7. It has jumped by over 158% from its lowest point in May this year. Ethereum (ETH) jumped to around $3,580, making it one of the best-performing…

Ethereum ETF mania: ETH targets $4,000—will key record break?

2 min read

Ethereum’s price jumped for six consecutive days, reaching its highest point since January 7. It has jumped by over 158% from its lowest point in May this year.

Ethereum (ETH) jumped to around $3,580, making it one of the best-performing coins this week. 

SoSoValue data shows that the surge coincided with the robust spot Ethereum ETF inflows during the week. These funds added a record $2.1 billion in assets, the biggest weekly gains on record. 

The inflow was much higher than the previous week’s $907 million. It was also the tenth consecutive week of positive Ethereum ETF inflows, marking the longest streak since the ETFs were approved in September last year. Most notably, their cumulative inflows jumped to over $7.49 billion.

BlackRock’s ETHA ETF is beating its rivals, with its assets jumping to $9.17 billion. It accounts for almost half of the assets in Ethereum ETFs. 

Ethereum price surged as the crypto industry faced numerous tailwinds, including the signing of the GENIUS Act. It also benefited from the ongoing accumulation by SharpLink, which has become one of the largest corporate holders, emulating Strategy’s success. 

Ethereum price surge also coincided with other strong numbers. For example, the futures open interest soared to a record high of $51 billion on Saturday, higher than last month’s low of $28 billion. Surging open interest is a sign that demand continues to rise. 

Additional metrics also rose, with the stablecoin supply reaching a record high of $130 billion, while decentralized finance assets surged to over $178 billion. 

Ethereum price technical analysis

Ethereum price

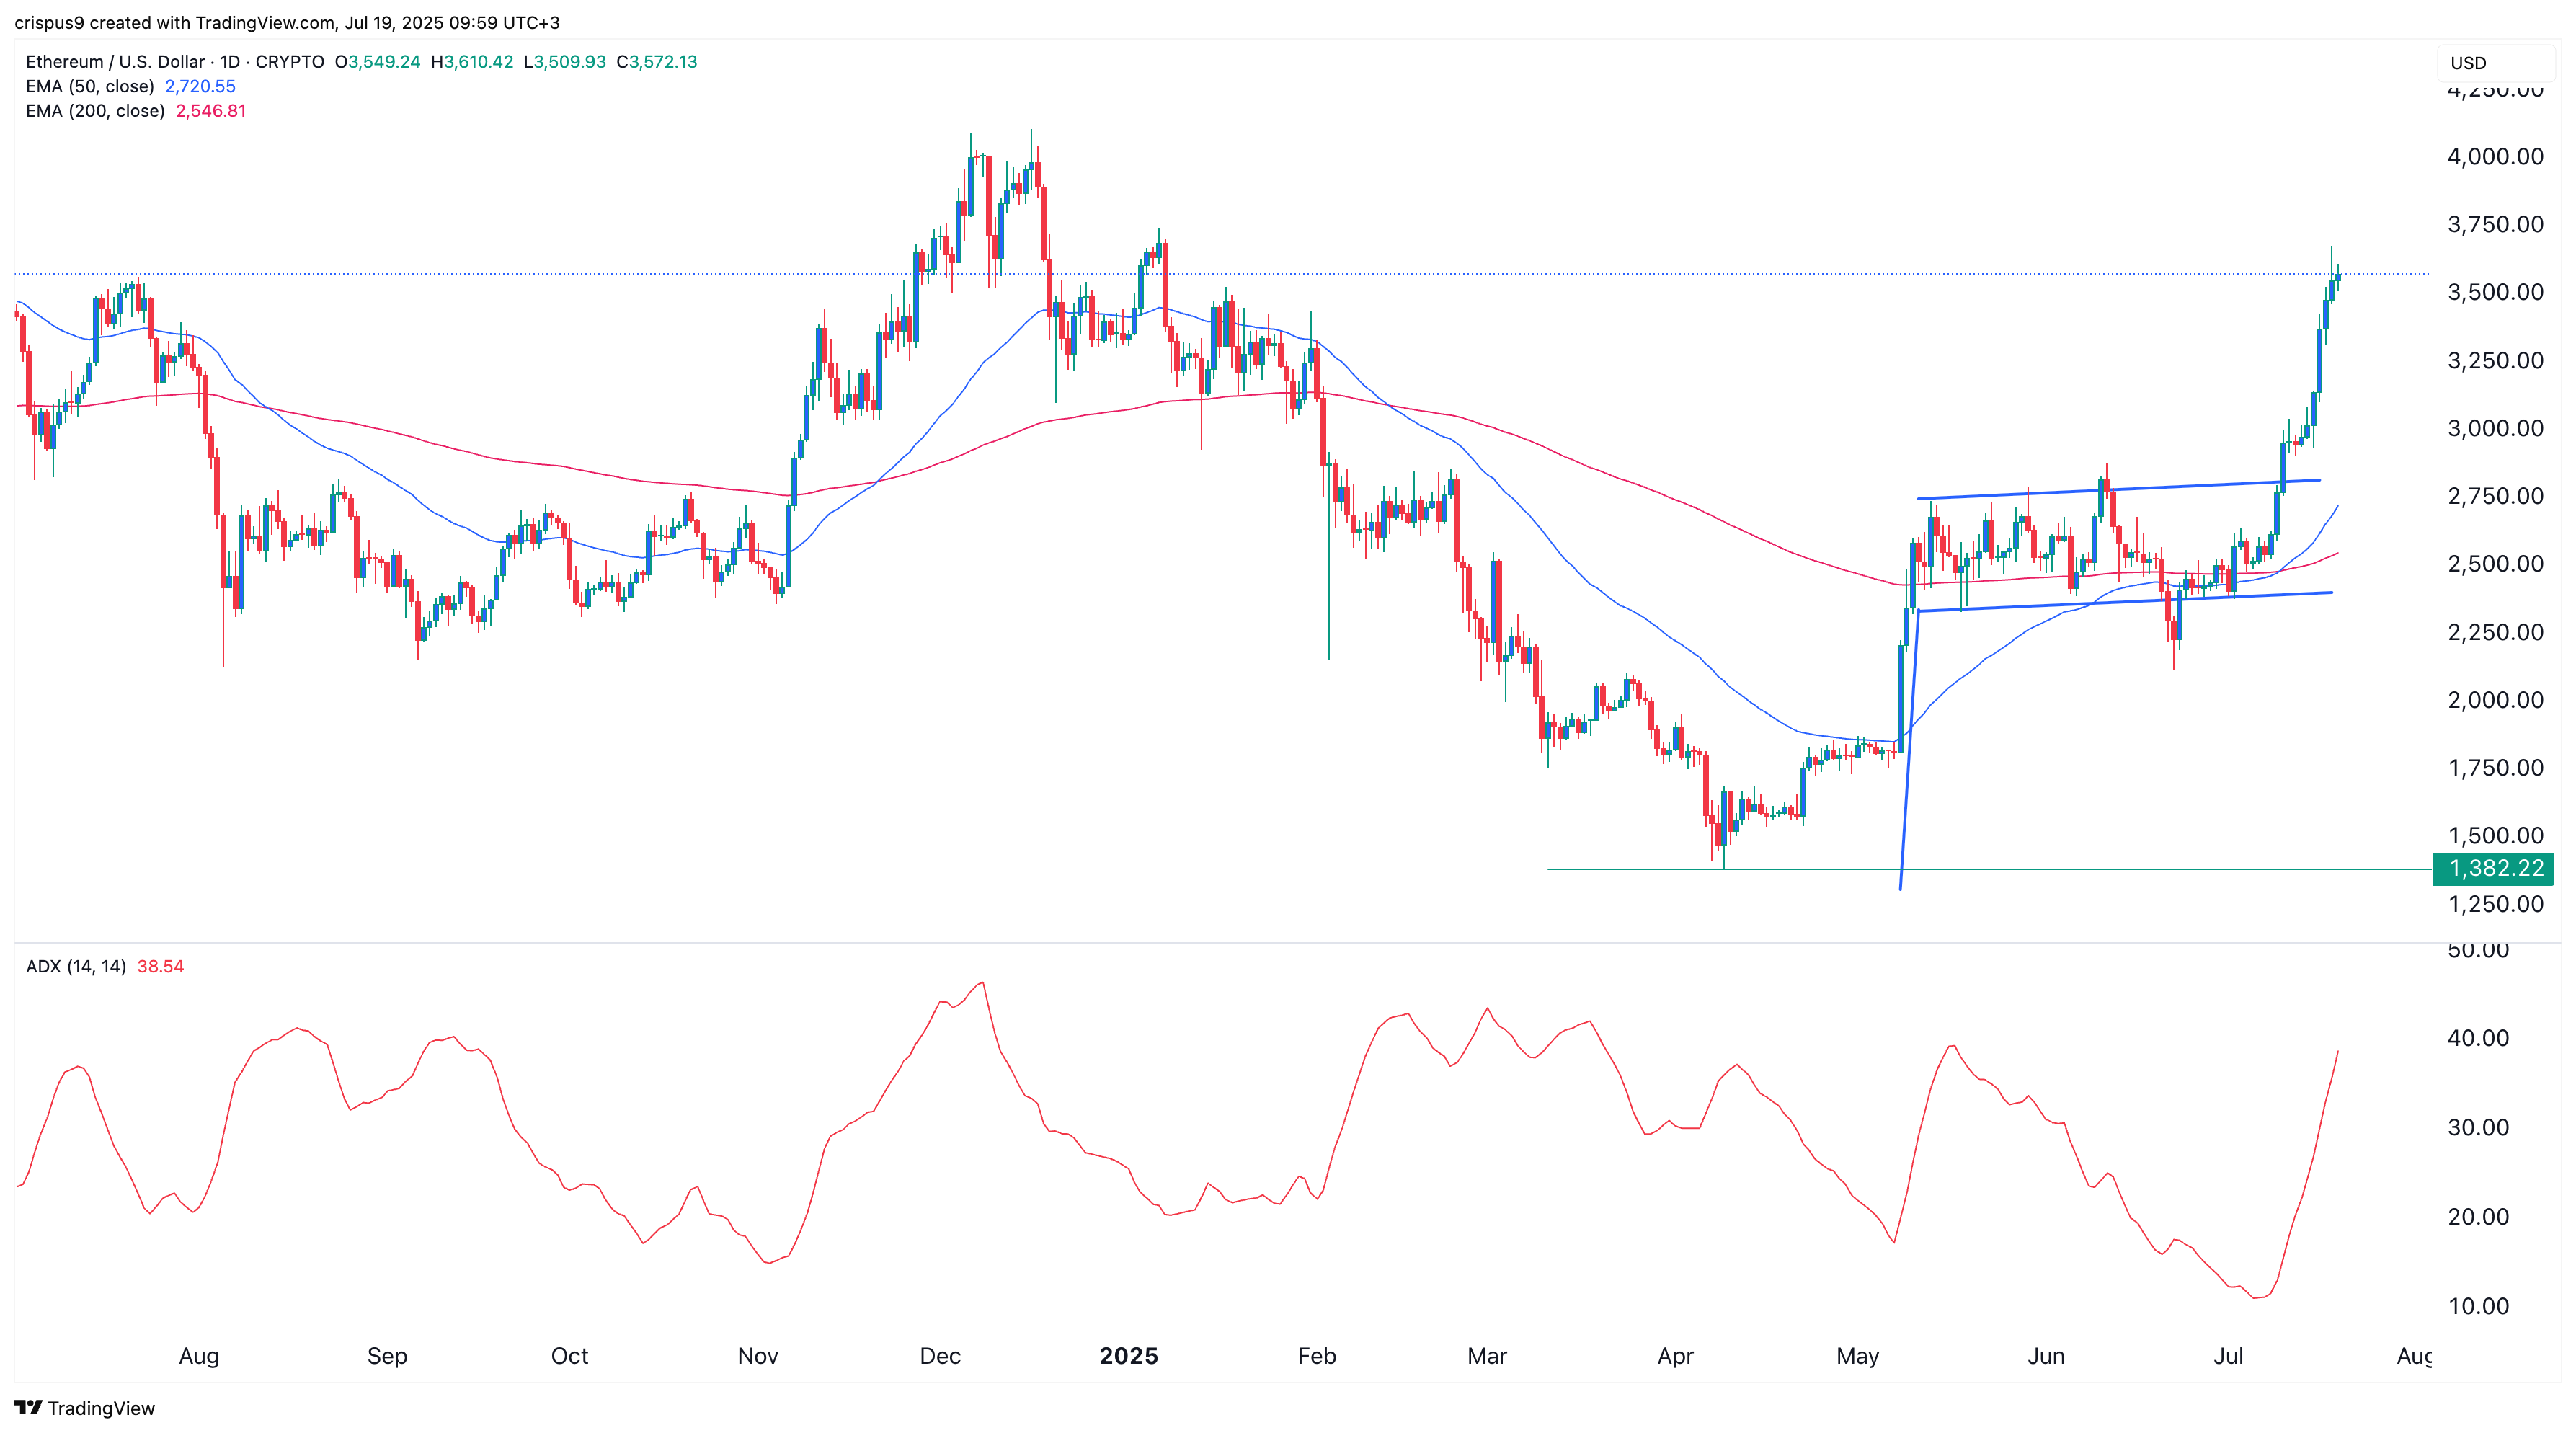
The daily chart shows that the ETH price has been in a strong bull run in the past few weeks, moving from a low of $1,382 in April to over $3,500. 

ETH has formed a golden cross as the 200-day and 50-day moving averages crossed each other. The Relative Strength Index has continued rising, while the Average Directional Index soared to 38, the highest point since May 17 this year. 

The soaring ADX indicator is a sign that ETH rally is gaining momentum. Therefore, the token will likely continue rising, with the next point to watch being at the psychological point at $4,000. However, with the coin being highly overbought, there is a risk that it will have a brief pullback and then resume the uptrend.

Market Opportunity
SIX Logo
SIX Price(SIX)
$0.01048
$0.01048$0.01048
+0.67%
USD
SIX (SIX) Live Price Chart
Disclaimer: The articles reposted on this site are sourced from public platforms and are provided for informational purposes only. They do not necessarily reflect the views of MEXC. All rights remain with the original authors. If you believe any content infringes on third-party rights, please contact [email protected] for removal. MEXC makes no guarantees regarding the accuracy, completeness, or timeliness of the content and is not responsible for any actions taken based on the information provided. The content does not constitute financial, legal, or other professional advice, nor should it be considered a recommendation or endorsement by MEXC.

You May Also Like

Egrag Crypto: XRP Could be Around $6 or $7 by Mid-November Based on this Analysis

Egrag Crypto: XRP Could be Around $6 or $7 by Mid-November Based on this Analysis

Egrag Crypto forecasts XRP reaching $6 to $7 by November. Fractal pattern analysis suggests a significant XRP price surge soon. XRP poised for potential growth based on historical price patterns. The cryptocurrency community is abuzz after renowned analyst Egrag Crypto shared an analysis suggesting that XRP could reach $6 to $7 by mid-November. This prediction is based on the study of a fractal pattern observed in XRP’s past price movements, which the analyst believes is likely to repeat itself in the coming months. According to Egrag Crypto, the analysis hinges on fractal patterns, which are used in technical analysis to identify recurring market behavior. Using the past price charts of XRP, the expert has found a certain fractal that looks similar to the existing market structure. The trend indicates that XRP will soon experience a great increase in price, and the asset will probably reach the $6 or $7 range in mid-November. The chart shared by Egrag Crypto points to a rising trend line with several Fibonacci levels pointing to key support and resistance zones. This technical structure, along with the fractal pattern, is the foundation of the price forecast. As XRP continues to follow the predicted trajectory, the analyst sees a strong possibility of it reaching new highs, especially if the fractal behaves as expected. Also Read: Why XRP Price Remains Stagnant Despite Fed Rate Cut #XRP – A Potential Similar Set-Up! I've been analyzing the yellow fractal from a previous setup and trying to fit it into various formations. Based on the fractal formation analysis, it suggests that by mid-November, #XRP could be around $6 to $7! Fractals can indeed be… pic.twitter.com/HmIlK77Lrr — EGRAG CRYPTO (@egragcrypto) September 18, 2025 Fractal Analysis: The Key to XRP’s Potential Surge Fractals are a popular tool for market analysis, as they can reveal trends and potential price movements by identifying patterns in historical data. Egrag Crypto’s focus on a yellow fractal pattern in XRP’s price charts is central to the current forecast. Having contrasted the market scenario at the current period and how it was at an earlier time, the analyst has indicated that XRP might revert to the same price scenario that occurred at a later cycle in the past. Egrag Crypto’s forecast of $6 to $7 is based not just on the fractal pattern but also on broader market trends and technical indicators. The Fibonacci retracements and extensions will also give more insight into the price levels that are likely to be experienced in the coming few weeks. With mid-November in sight, XRP investors and traders will be keeping a close eye on the market to see if Egrag Crypto’s analysis is true. If the price targets are reached, XRP could experience one of its most significant rallies in recent history. Also Read: Top Investor Issues Advance Warning to XRP Holders – Beware of this Risk The post Egrag Crypto: XRP Could be Around $6 or $7 by Mid-November Based on this Analysis appeared first on 36Crypto.
Share
Coinstats2025/09/18 18:36
‘High Risk’ Projects Dominate Crypto Press Releases, Report Finds

‘High Risk’ Projects Dominate Crypto Press Releases, Report Finds

The post ‘High Risk’ Projects Dominate Crypto Press Releases, Report Finds appeared on BitcoinEthereumNews.com. More than six in 10 crypto press releases published
Share
BitcoinEthereumNews2026/02/04 13:09
Why Vitalik Says L2s Aren’t Ethereum Shards Now?

Why Vitalik Says L2s Aren’t Ethereum Shards Now?

The post Why Vitalik Says L2s Aren’t Ethereum Shards Now? appeared on BitcoinEthereumNews.com. Vitalik says Ethereum’s scaling and higher gas limits mean L2s no
Share
BitcoinEthereumNews2026/02/04 13:18