

Solana (SOL) Picks Up Speed, Raising Talk of a New Upside Run
Solana started a fresh increase above the $136 zone. SOL price is now consolidating above $138 and might aim for more gains above the $142 zone.
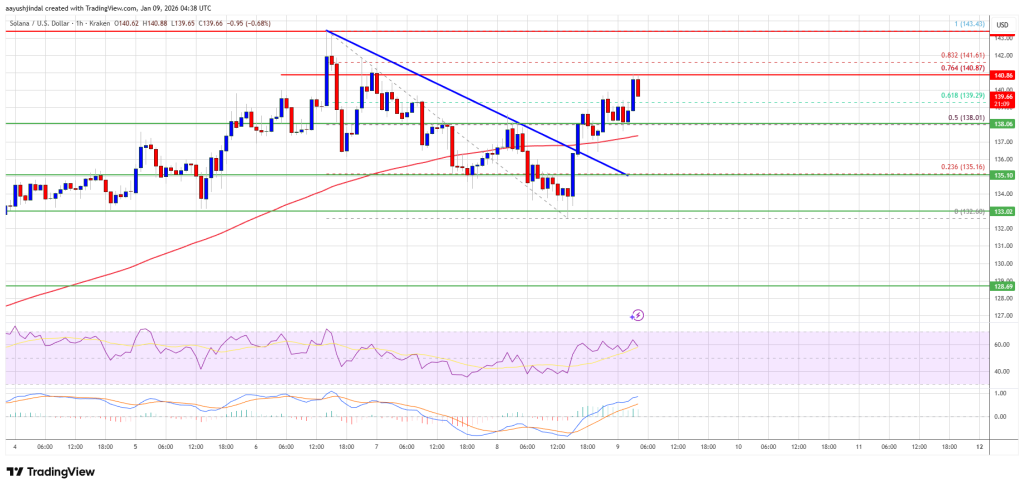
- SOL price started a fresh upward move above the $136 and $138 levels against the US Dollar.
- The price is now trading above $138 and the 100-hourly simple moving average.
- There was a break above a bearish trend line with resistance at $137 on the hourly chart of the SOL/USD pair (data source from Kraken).
- The pair could extend gains if it clears the $142 resistance zone.
Solana Price Regains Traction
Solana price corrected gains from the $144 zone but remained stable above the $130 zone, beating Bitcoin and Ethereum. SOL formed a low near $132 and started a fresh upward move.
The price climbed above the $135 level to enter a short-term positive zone. It surpassed the 50% Fib retracement level of the downward move from the $143 swing high to the $132 low. Besides, there was a break above a bearish trend line with resistance at $137 on the hourly chart of the SOL/USD pair.
Solana is now trading above $138 and the 100-hourly simple moving average. On the upside, the price is facing resistance near $140 and the 76.4% Fib retracement level of the downward move from the $143 swing high to the $132 low. The next major resistance is near the $142 level.
The main resistance could be $145. A successful close above the $145 resistance zone could set the pace for another steady increase. The next key resistance is $150. Any more gains might send the price toward the $155 level.
Another Decline In SOL?
If SOL fails to rise above the $140 resistance, it could start another decline. Initial support on the downside is near the $138 zone. The first major support is near the $135 level.
A break below the $135 level might send the price toward the $132 support zone. If there is a close below the $132 support, the price could decline toward the $124 support in the near term.
Technical Indicators
Hourly MACD – The MACD for SOL/USD is gaining pace in the bullish zone.
Hourly Hours RSI (Relative Strength Index) – The RSI for SOL/USD is above the 50 level.
Major Support Levels – $138 and $135.
Major Resistance Levels – $140 and $142.
You May Also Like

U.S. workers received 53.8% of GDP in the third quarter, the lowest share since records began in 1947

Why AI Needs Access Controls Before It Gets Out of Control
