

Ethereum Price Outlook: Accumulation Zone Holds, $3,300 Next?
TLDR
- ETH price trades in a defined range, holding key support between $2,500 and $2,800.
- Analysts flag $2,800 as a key accumulation zone amid weakening sell pressure.
- Short-term liquidity sweeps near $3,000 are driving tactical price moves.
- A reclaim of $3,300 could shift momentum back in favor of Ethereum bulls.
Ethereum(ETH) price is consolidating after a volatile second half of 2025, with traders watching key support zones closely. Technical analysts point to defined accumulation levels, short-term liquidity dynamics, and the wider market correlations shaping near-term direction. Price targets around $3,300 remain in focus if current support holds into early 2026.
Ethereum Price Tracks the Wider Market Structure
According to analyst Crypto Rover, the crypto market remains within a long-term bullish framework despite recent pullbacks. While his weekly chart focuses on Bitcoin, the structure offers context for Ethereum’s positioning. Major assets are digesting gains after late-2025 highs, rather than showing signs of cycle failure.
Rover highlighted the importance of buying near structural support, often referred to as accumulation zones. This approach reflects confidence in long-term adoption trends and institutional participation. For Ethereum price, similar behavior has historically followed Bitcoin’s stabilization phases.
Moreover, the current environment features thinner year-end liquidity and heightened volatility. These conditions often exaggerate moves around support and resistance. As a result, short-term weakness does not necessarily invalidate the broader bullish outlook heading into 2026.
Ethereum Price Range Defines Accumulation Zone
Meanwhile, according to analyst Ted Pillow’s ETH against USD chart, Ethereum price has spent recent months in a defined descending range. Resistance remains clustered between $3,300 and $3,800, repeatedly capping upside attempts. On the downside, support has consistently held between $2,500 and $2,800.
Recent price action shows Ethereum price pulling back toward the $2,900 zone after failing to sustain a breakout above $3,200. Selling pressure appears to be weakening, with volume declining during downside moves. This behavior often signals seller exhaustion rather than aggressive distribution.
Analyst Ted identified the $2,800 level as a key accumulation zone. From a risk-reward perspective, buyers see asymmetry if support holds and price rotates higher. A confirmed reclaim of $3,300 would likely shift short-term momentum back in favor of bulls, while a break below $2,800 opens room toward $2,500.
Short-Term Liquidity Shapes Ethereum Price Moves
In addition, Lennaert Snyder provides a tactical view using a lower-timeframe ETH perpetual futures chart. His analysis highlights a descending wedge pattern forming near $3,000. Price recently swept liquidity below $2,920 before bouncing toward resistance near $3,076.
Snyder noted stacked liquidity both below $2,800 and above $3,155. These zones often act as magnets during periods of compression. Short-term traders are watching for either a rejection at resistance or a confirmed market structure shift higher.
Furthermore, the chart points to flexibility rather than directional conviction. A rejection after a liquidity sweep could favor short positions, while a clean reclaim of higher levels would support longs toward $3,155. Untapped liquidity below $2,800 remains a risk if momentum fades, reinforcing the need for confirmation-based strategies.
Ethereum price remains range-bound but technically constructive. Accumulation near established support aligns with weakening selling pressure and defined risk levels. If broader market conditions stabilize, the Ethereum price could attempt a move toward $3,300 before year-end volatility subsides.
The post Ethereum Price Outlook: Accumulation Zone Holds, $3,300 Next? appeared first on CoinCentral.
You May Also Like

Michael Saylor: Bitcoin Treasury Firms May Shift to Digital Credit Models
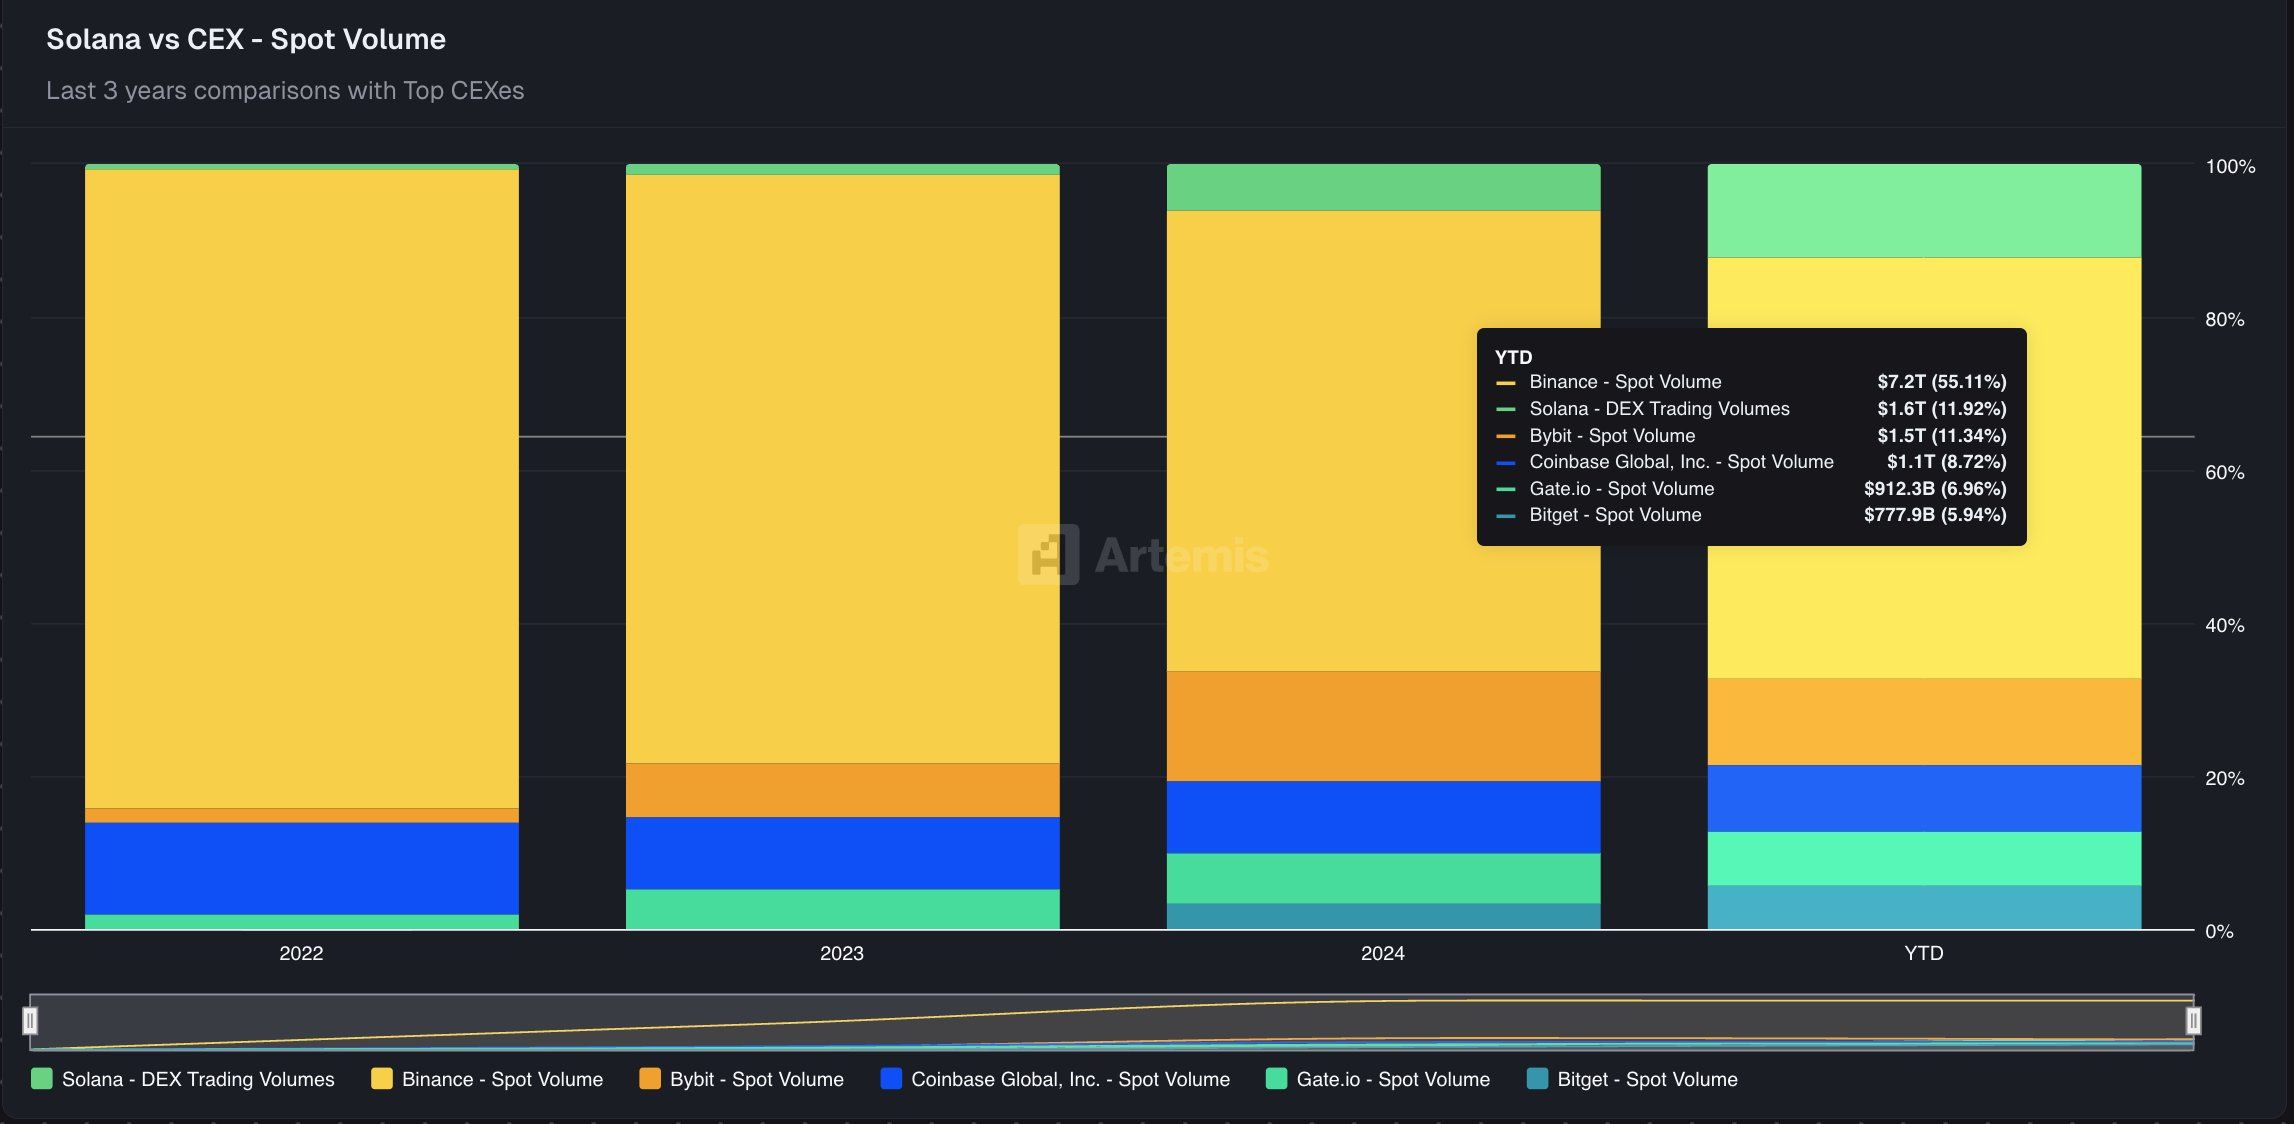
Solana DEXs Overtake Top Exchanges With $1.6 Trillion Volume Despite SOL Price Stagnation
