With the fear staying intact, the cryptocurrency market has ranged a brief bullish call as of December 26. The majority of the assets are currently facing mixedWith the fear staying intact, the cryptocurrency market has ranged a brief bullish call as of December 26. The majority of the assets are currently facing mixed

Momentum Builds for World Liberty Financial (WLFI): Is There More Upside Left?

  • World Liberty Financial trades at $0.14 after a 7% gain.
  • WLFI’s daily trading volume has increased by over 94%.

With the fear staying intact, the cryptocurrency market has ranged a brief bullish call as of December 26. The majority of the assets are currently facing mixed signals, which include Bitcoin (BTC) and Ethereum (ETH). Meanwhile, World Liberty Financial (WLFI) has posted a 7.56% gain in value in the last 24 hours. 

WLFI was trading at a bottom range of $0.1335 in the early hours, and the bullish wave has triggered the price to move up to a high of $0.1447. Notably, upon the active uptrend staying, it may invite additional gains, and will also seek to escape the broader bearish hold. 

The CoinMarketCap data has revealed that at the time of writing, World Liberty Financial trades within the $0.1436 zone, with its market cap touching $3.81 billion. Besides, the asset’s daily trading volume has exploded by over 94.34%, reaching the $105.2 million mark.

Can World Liberty Financial Maintain its Upward Trajectory?

The technical analysis of World Liberty Financial reports that the Moving Average Convergence Divergence (MACD) line is above the signal line, indicating bullish momentum. The buying pressure is strengthening, and the trend may continue upward.

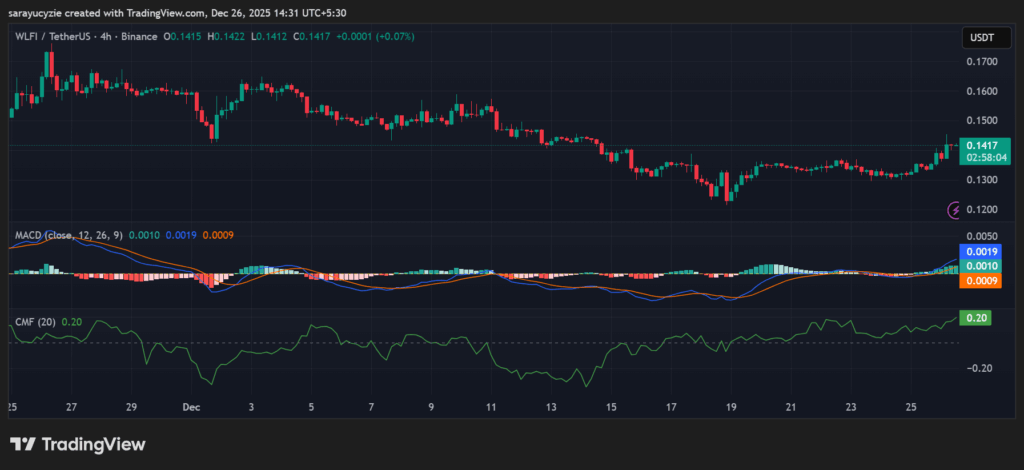
WLFI chart (Source: TradingView)

Moreover, WLFI’s Chaikin Money Flow (CMF) indicator at 0.20 suggests strong buying pressure in the market. The money is flowing into the asset, showing accumulation. Also, the strength is relatively high, pointing to healthy bullish momentum. 

With the recent trading pattern of World Liberty Financial, the price might test the crucial resistance at $0.1460. More pressure on the upside could trigger the golden cross to take place, and take the asset’s price above $0.1485. Conversely, a bearish shift could push the World Liberty Financial price down to the $0.1411 support. Further downside correction might strengthen the bears and initiate the death cross to emerge, and drive the price below $0.1375.

Furthermore, the market sentiment of WLFI is bullish, approaching overbought territory, with the daily Relative Strength Index (RSI) value at 69.67. The buying momentum is strong, and there is still upside potential, but the risk of a short-term pullback is increasing. World Liberty Financial’s Bull Bear Power (BBP) reading of 0.0100 implies slight bullish dominance. As the magnitude is modest, the bullish momentum is weak but not very strong.

Top Updated Crypto News

Downtrend Test for Cardano (ADA): Will Selling Pressure Intensify for a Deeper Slide?

Market Opportunity
Torch of Liberty Logo
Torch of Liberty Price(LIBERTY)
$0.01122
$0.01122$0.01122
-0.26%
USD
Torch of Liberty (LIBERTY) Live Price Chart
Disclaimer: The articles reposted on this site are sourced from public platforms and are provided for informational purposes only. They do not necessarily reflect the views of MEXC. All rights remain with the original authors. If you believe any content infringes on third-party rights, please contact [email protected] for removal. MEXC makes no guarantees regarding the accuracy, completeness, or timeliness of the content and is not responsible for any actions taken based on the information provided. The content does not constitute financial, legal, or other professional advice, nor should it be considered a recommendation or endorsement by MEXC.

You May Also Like

FCA komt in 2026 met aangepaste cryptoregels voor Britse markt

FCA komt in 2026 met aangepaste cryptoregels voor Britse markt

De Britse financiële waakhond, de FCA, komt in 2026 met nieuwe regels speciaal voor crypto bedrijven. Wat direct opvalt: de toezichthouder laat enkele klassieke financiële verplichtingen los om beter aan te sluiten op de snelle en grillige wereld van digitale activa. Tegelijkertijd wordt er extra nadruk gelegd op digitale beveiliging,... Het bericht FCA komt in 2026 met aangepaste cryptoregels voor Britse markt verscheen het eerst op Blockchain Stories.
Share
Coinstats2025/09/18 00:33
Liquidity Boost Stabilizes Solana-Based Stablecoin USX After Market Drop

Liquidity Boost Stabilizes Solana-Based Stablecoin USX After Market Drop

Solana's USX stablecoin experiences a significant market drop due to liquidity issues. Solstice Finance intervenes to stabilize the value.Read more...
Share
Coinstats2025/12/27 12:51
Edges higher ahead of BoC-Fed policy outcome

Edges higher ahead of BoC-Fed policy outcome

The post Edges higher ahead of BoC-Fed policy outcome appeared on BitcoinEthereumNews.com. USD/CAD gains marginally to near 1.3760 ahead of monetary policy announcements by the Fed and the BoC. Both the Fed and the BoC are expected to lower interest rates. USD/CAD forms a Head and Shoulder chart pattern. The USD/CAD pair ticks up to near 1.3760 during the late European session on Wednesday. The Loonie pair gains marginally ahead of monetary policy outcomes by the Bank of Canada (BoC) and the Federal Reserve (Fed) during New York trading hours. Both the BoC and the Fed are expected to cut interest rates amid mounting labor market conditions in their respective economies. Inflationary pressures in the Canadian economy have cooled down, emerging as another reason behind the BoC’s dovish expectations. However, the Fed is expected to start the monetary-easing campaign despite the United States (US) inflation remaining higher. Investors will closely monitor press conferences from both Fed Chair Jerome Powell and BoC Governor Tiff Macklem to get cues about whether there will be more interest rate cuts in the remainder of the year. According to analysts from Barclays, the Fed’s latest median projections for interest rates are likely to call for three interest rate cuts by 2025. Ahead of the Fed’s monetary policy, the US Dollar Index (DXY), which tracks the Greenback’s value against six major currencies, holds onto Tuesday’s losses near 96.60. USD/CAD forms a Head and Shoulder chart pattern, which indicates a bearish reversal. The neckline of the above-mentioned chart pattern is plotted near 1.3715. The near-term trend of the pair remains bearish as it stays below the 20-day Exponential Moving Average (EMA), which trades around 1.3800. The 14-day Relative Strength Index (RSI) slides to near 40.00. A fresh bearish momentum would emerge if the RSI falls below that level. Going forward, the asset could slide towards the round level of…
Share
BitcoinEthereumNews2025/09/18 01:23