The post Bitcoin (BTC) Price Retests Weekly Demand Zone: Is This the Higher Low Bulls Need? appeared first on Coinpedia Fintech News Bitcoin is consolidating just above an important weekly demand zone, with price hovering near $91,358 in early trade. Volatility has tightened, liquidity pockets have shifted, and traders are now watching whether the BTC price can form a clean higher-time-frame higher low—the kind that typically precedes a renewed push toward all-time highs. But if demand fails, …The post Bitcoin (BTC) Price Retests Weekly Demand Zone: Is This the Higher Low Bulls Need? appeared first on Coinpedia Fintech News Bitcoin is consolidating just above an important weekly demand zone, with price hovering near $91,358 in early trade. Volatility has tightened, liquidity pockets have shifted, and traders are now watching whether the BTC price can form a clean higher-time-frame higher low—the kind that typically precedes a renewed push toward all-time highs. But if demand fails, …

Bitcoin (BTC) Price Retests Weekly Demand Zone: Is This the Higher Low Bulls Need?

3 min read
Bitcoin Price Prediction 2025, What Next For BTC Price

The post Bitcoin (BTC) Price Retests Weekly Demand Zone: Is This the Higher Low Bulls Need? appeared first on Coinpedia Fintech News

Bitcoin is consolidating just above an important weekly demand zone, with price hovering near $91,358 in early trade. Volatility has tightened, liquidity pockets have shifted, and traders are now watching whether the BTC price can form a clean higher-time-frame higher low—the kind that typically precedes a renewed push toward all-time highs. But if demand fails, this could become the first structural breakdown that may extend the pullback below $85,000. 

A Crucial Retest of Weekly Demand 

Bitcoin price has pulled back to retest the $89,500–$92,000 weekly demand zone, a region that previously served as the launchpad for its breakout above $95,000 earlier this year. With the price now trading near $91,358, BTC is sitting right at the midpoint of this demand pocket, where buyers historically stepped in with strong spot-driven momentum.

This area is critical because it represents the last defended higher low on the weekly chart. As long as BTC holds above $89,500, the higher-time-frame bullish structure remains intact. A clean rebound from this range could propel the price back toward $93,800, followed by a retest of $95,200, the level where sellers capped the previous rally.

However, a breakdown below $89,500 on high volume would flip this zone into supply and open a corrective move toward $86,700, the next major weekly support. 

Technical Structure: Bulls Need Momentum Soon

Momentum indicators across higher time frames show cooling demand, but structure remains bullish as long as BTC prints a higher low above $89.5K. Spot flows have slowed, but derivative positioning remains neutral, setting the stage for an impulsive move once liquidity gets cleared on either side.

bitcoin price

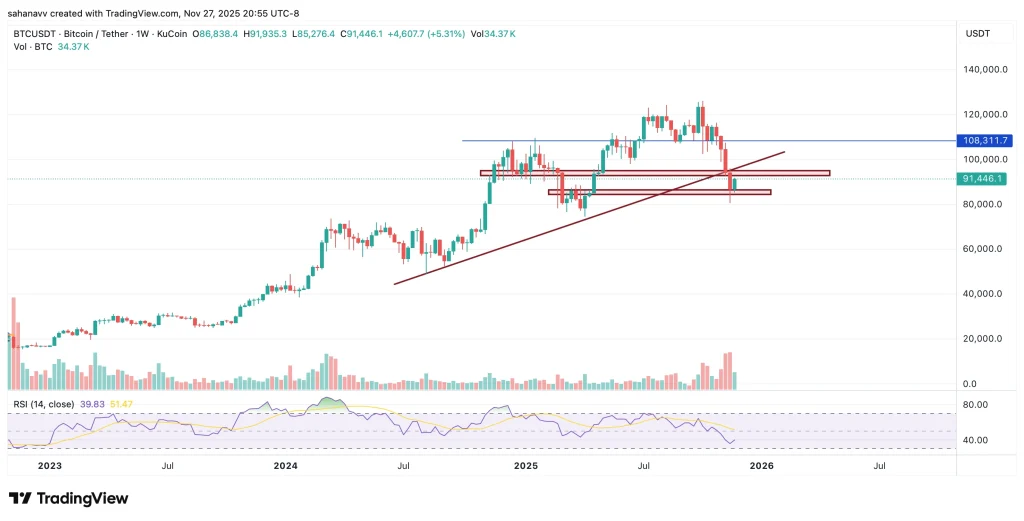
The BTC price broke the ascending trend line, which has been acting as a strong support since July 2024. Although the bulls have initiated a rebound, it is not strong enough to push the price beyond the range. Interestingly, the weekly RSI reached close to the lower threshold for the first time since December 2022, hinting towards over exhaustion of the rally. And hence, a decent rebound with a continued upswing seems to be inevitable. However, to attract the bulls, the Bitcoin price is required to clear the resistance zone between $93,000 and $97,000. 

Key technical levels to watch:

  • Immediate Support: $90,200
  • Weekly Demand Floor: $89,500
  • Bounce Targets: $93,800 → $95,200
  • Bull Trigger: H4 reclaim of $93K with rising spot volume
  • Bear Trigger: Weekly close below $89,500

What Traders Are Watching Next

Market participants are tracking:

  • Spot CEX inflows/outflows → To confirm whether real buy pressure returns.
  • Liquidity clusters around $90,000 and $93,000 → Areas likely to get swept before direction.
  • Low-volume pocket above $94,000 → Could enable a quick expansion if bulls regain strength.
  • Macro calendar: With a light data week, technicals and liquidity behavior will dominate near-term movement.

Many traders are also anticipating that BTC may need one more liquidity sweep below $90K before establishing the weekly higher low.

Conclusion

Bitcoin is approaching a decision point. Holding the $89,500–$92,000 demand zone would solidify a higher-time-frame higher low and reopen the path toward $95K and beyond. But losing this zone risks a deeper retest of $86,700, which would challenge the strength of the broader bullish market structure.

Market Opportunity
Bitcoin Logo
Bitcoin Price(BTC)
$76,541.44
$76,541.44$76,541.44
-2.03%
USD
Bitcoin (BTC) Live Price Chart
Disclaimer: The articles reposted on this site are sourced from public platforms and are provided for informational purposes only. They do not necessarily reflect the views of MEXC. All rights remain with the original authors. If you believe any content infringes on third-party rights, please contact [email protected] for removal. MEXC makes no guarantees regarding the accuracy, completeness, or timeliness of the content and is not responsible for any actions taken based on the information provided. The content does not constitute financial, legal, or other professional advice, nor should it be considered a recommendation or endorsement by MEXC.

You May Also Like

Egrag Crypto: XRP Could be Around $6 or $7 by Mid-November Based on this Analysis

Egrag Crypto: XRP Could be Around $6 or $7 by Mid-November Based on this Analysis

Egrag Crypto forecasts XRP reaching $6 to $7 by November. Fractal pattern analysis suggests a significant XRP price surge soon. XRP poised for potential growth based on historical price patterns. The cryptocurrency community is abuzz after renowned analyst Egrag Crypto shared an analysis suggesting that XRP could reach $6 to $7 by mid-November. This prediction is based on the study of a fractal pattern observed in XRP’s past price movements, which the analyst believes is likely to repeat itself in the coming months. According to Egrag Crypto, the analysis hinges on fractal patterns, which are used in technical analysis to identify recurring market behavior. Using the past price charts of XRP, the expert has found a certain fractal that looks similar to the existing market structure. The trend indicates that XRP will soon experience a great increase in price, and the asset will probably reach the $6 or $7 range in mid-November. The chart shared by Egrag Crypto points to a rising trend line with several Fibonacci levels pointing to key support and resistance zones. This technical structure, along with the fractal pattern, is the foundation of the price forecast. As XRP continues to follow the predicted trajectory, the analyst sees a strong possibility of it reaching new highs, especially if the fractal behaves as expected. Also Read: Why XRP Price Remains Stagnant Despite Fed Rate Cut #XRP – A Potential Similar Set-Up! I've been analyzing the yellow fractal from a previous setup and trying to fit it into various formations. Based on the fractal formation analysis, it suggests that by mid-November, #XRP could be around $6 to $7! Fractals can indeed be… pic.twitter.com/HmIlK77Lrr — EGRAG CRYPTO (@egragcrypto) September 18, 2025 Fractal Analysis: The Key to XRP’s Potential Surge Fractals are a popular tool for market analysis, as they can reveal trends and potential price movements by identifying patterns in historical data. Egrag Crypto’s focus on a yellow fractal pattern in XRP’s price charts is central to the current forecast. Having contrasted the market scenario at the current period and how it was at an earlier time, the analyst has indicated that XRP might revert to the same price scenario that occurred at a later cycle in the past. Egrag Crypto’s forecast of $6 to $7 is based not just on the fractal pattern but also on broader market trends and technical indicators. The Fibonacci retracements and extensions will also give more insight into the price levels that are likely to be experienced in the coming few weeks. With mid-November in sight, XRP investors and traders will be keeping a close eye on the market to see if Egrag Crypto’s analysis is true. If the price targets are reached, XRP could experience one of its most significant rallies in recent history. Also Read: Top Investor Issues Advance Warning to XRP Holders – Beware of this Risk The post Egrag Crypto: XRP Could be Around $6 or $7 by Mid-November Based on this Analysis appeared first on 36Crypto.
Share
Coinstats2025/09/18 18:36
‘High Risk’ Projects Dominate Crypto Press Releases, Report Finds

‘High Risk’ Projects Dominate Crypto Press Releases, Report Finds

The post ‘High Risk’ Projects Dominate Crypto Press Releases, Report Finds appeared on BitcoinEthereumNews.com. More than six in 10 crypto press releases published
Share
BitcoinEthereumNews2026/02/04 13:09
Why Vitalik Says L2s Aren’t Ethereum Shards Now?

Why Vitalik Says L2s Aren’t Ethereum Shards Now?

The post Why Vitalik Says L2s Aren’t Ethereum Shards Now? appeared on BitcoinEthereumNews.com. Vitalik says Ethereum’s scaling and higher gas limits mean L2s no
Share
BitcoinEthereumNews2026/02/04 13:18