

Solana (SOL) Must Conquer $85 Resistance to Reach $100 Target
Key Takeaways
- Fear and uncertainty surrounding Solana hit 2026 peaks while trading volumes plunged to yearly lows
- A critical resistance barrier exists between $79 and $85 where approximately 105 million SOL tokens were previously traded
- Successfully breaching $85 could trigger a rally toward $100, followed by $127; failure may result in a decline to $53 or beyond
- Network fundamentals remained robust in Q2 despite bearish price action and market sentiment
- Crypto analyst Michaël van de Poppe emphasizes that maintaining the $73-$76 zone is essential for any upward movement past $100
Solana currently confronts unprecedented levels of market anxiety and skepticism for 2026. Simultaneously, trading activity has plummeted to its weakest point this year, data from Santiment reveals.
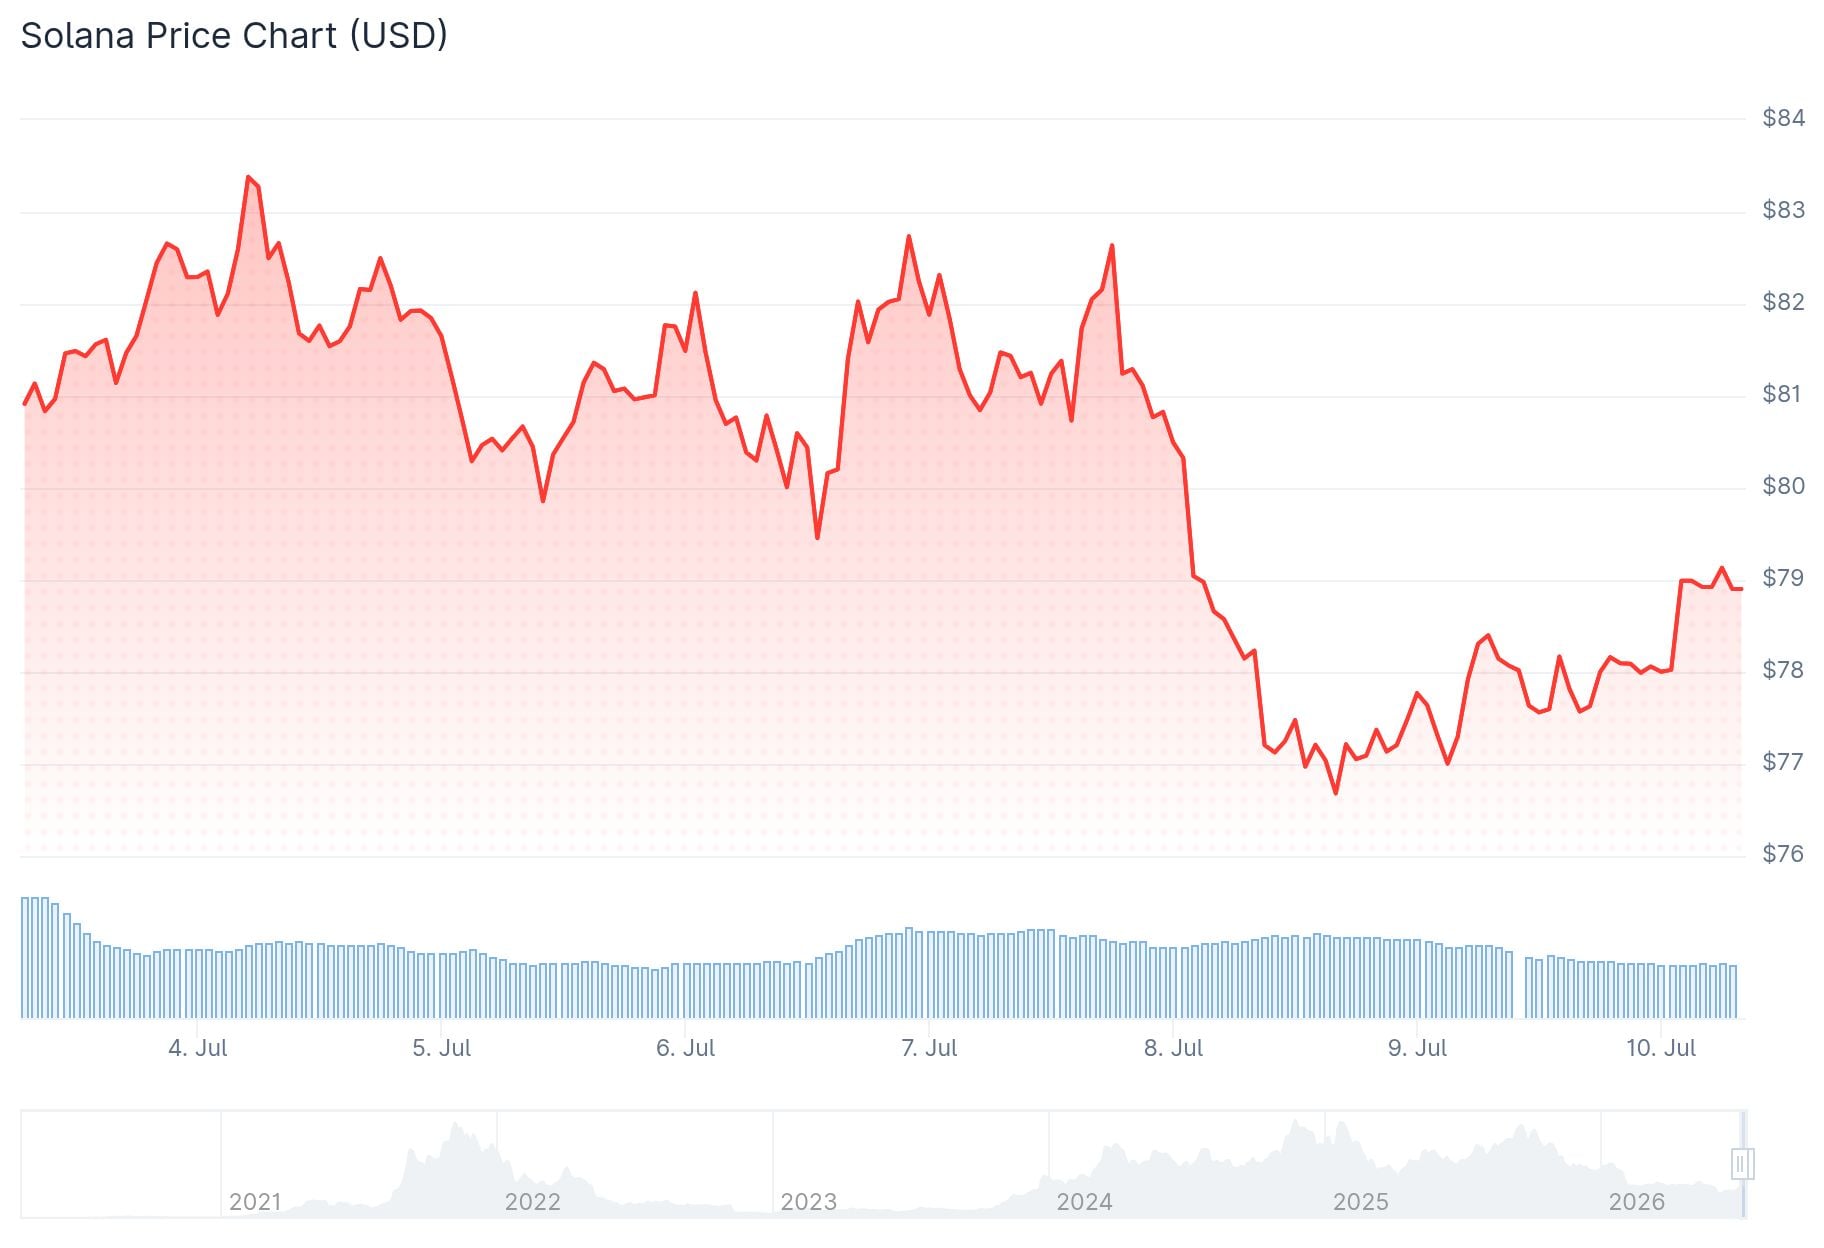 Solana (SOL) Price
Market participants have adopted a wait-and-see approach. Disappointment has set in after SOL underperformed relative to expectations, despite heightened interest in tokenized equities and real-world asset initiatives built on its blockchain.
Santiment observed that the convergence of pessimistic sentiment with diminished trading volumes can occasionally weaken selling pressure. This environment may allow institutional buyers to accumulate positions with minimal resistance.
Crypto strategist Michaël van de Poppe shared his perspective on X, stating that maintaining support within the $73-$76 corridor and establishing a bounce from that level would signal market readiness for a breakout above $100. He cautioned that losing this critical zone could trigger widespread declines.
Massive Supply Cluster Creates Overhead Resistance
Market analyst Ali Charts identified approximately 105 million SOL tokens that previously traded hands within the $79-$85 price band. This concentration represents significant overhead resistance, as holders approaching their entry prices may be inclined to liquidate positions.
Should buying pressure drive SOL beyond $85 while establishing that threshold as new support, subsequent price objectives would be $100 followed by $127. Conversely, rejection at this resistance could precipitate a retreat toward $53, with additional support zones located between $45 and $36.
Analyst Astekz similarly identified $45.60 and $36.64 as critical downside objectives should SOL fail to maintain its current trading range.
Robust On-Chain Metrics Contrast Bearish Price Action
Contrary to the pessimistic market sentiment, Solana’s Q2 blockchain metrics painted an encouraging picture. The network handled approximately 100 million transactions daily. Average daily active addresses reached 1.93 million, while decentralized exchange volumes averaged $2.09 billion per day.
Decentralized applications operating on Solana produced $262 million in quarterly revenue. This achievement marked the ninth consecutive quarter where Solana led all blockchains in Web3 application revenue, capturing 41% of the total market share.
Real-world assets deployed on the platform expanded from $2 billion in March to surpass $3.48 billion by July. Stablecoin transaction volume climbed to $1.79 trillion in June, representing a 63% increase from the previous month.
Pump.fun contributed $91.43 million in revenue throughout Q2. The first week of July witnessed a historic milestone with over one billion non-vote transactions recorded on the network.
SOL remains trapped between compelling blockchain fundamentals and hesitant trader positioning, with the $79-$85 supply concentration serving as the decisive battleground.
The post Solana (SOL) Must Conquer $85 Resistance to Reach $100 Target appeared first on Blockonomi.


You May Also Like

Chris Burniske Forecasts Big Changes Coming to Cryptocurrency Market

Not a loophole: Singapore AI export controls let China tap US AI legally

Magnificent 7 Stocks Ranked: Why Alphabet, Microsoft, and Amazon Top the List



