

SUI Price Prediction: Sui Faces a Major Test as Bitwise Files for a Spot ETF
Key highlights:
- The SUI price is holding the $0.50-$0.65 Fibonacci support zone, with $0.80 and $1.02 acting as the next major resistance levels
- Bitwise has filed for a spot SUI ETF, introducing a potential institutional catalyst as the SEC begins its review process
- CoinCodex's 1-month SUI price prediction targets $0.5332, pointing to limited upside unless buyers reclaim key resistance levels
Sui is back on traders' watchlists after Bitwise filed paperwork with the U.S. Securities and Exchange Commission for a spot SUI ETF. The filing doesn't mean approval is guaranteed, but it does place Sui alongside a growing list of crypto assets seeking regulated investment products in the United States.
At the same time, the charts are beginning to show early signs that selling pressure could be easing. Crypto analyst More Crypto Online believes SUI is still trading within a major Fibonacci support zone, though the recovery has been weaker than many bulls expected.
With technical support holding and the ETF application introducing a fresh catalyst, traders are asking the same question: can the SUI price finally begin a larger recovery?
The SUI price is testing a critical support zone
We had a look at More Crypto Online's daily chart, and the main area to watch is between $0.50 and $0.65. This zone lines up with the 78.6% and 88.7% Fibonacci retracement levels, which often act as support during extended corrections.
The analyst views the decline as part of an Elliott Wave ABC correction. If that count is correct, wave C may be nearing completion, opening the door for a broader recovery. The first resistance comes in around $1.02, which matches the 23.6% Fibonacci retracement. Above that, the next major target is $1.71, the 50% retracement level.
There is still another possibility. The analyst notes that the latest bounce may only be a temporary recovery before one final move lower. If buyers lose control of the $0.50-$0.65 support zone, the correction may continue before any sustained rebound begins.
Momentum is improving, but buyers still have work to do
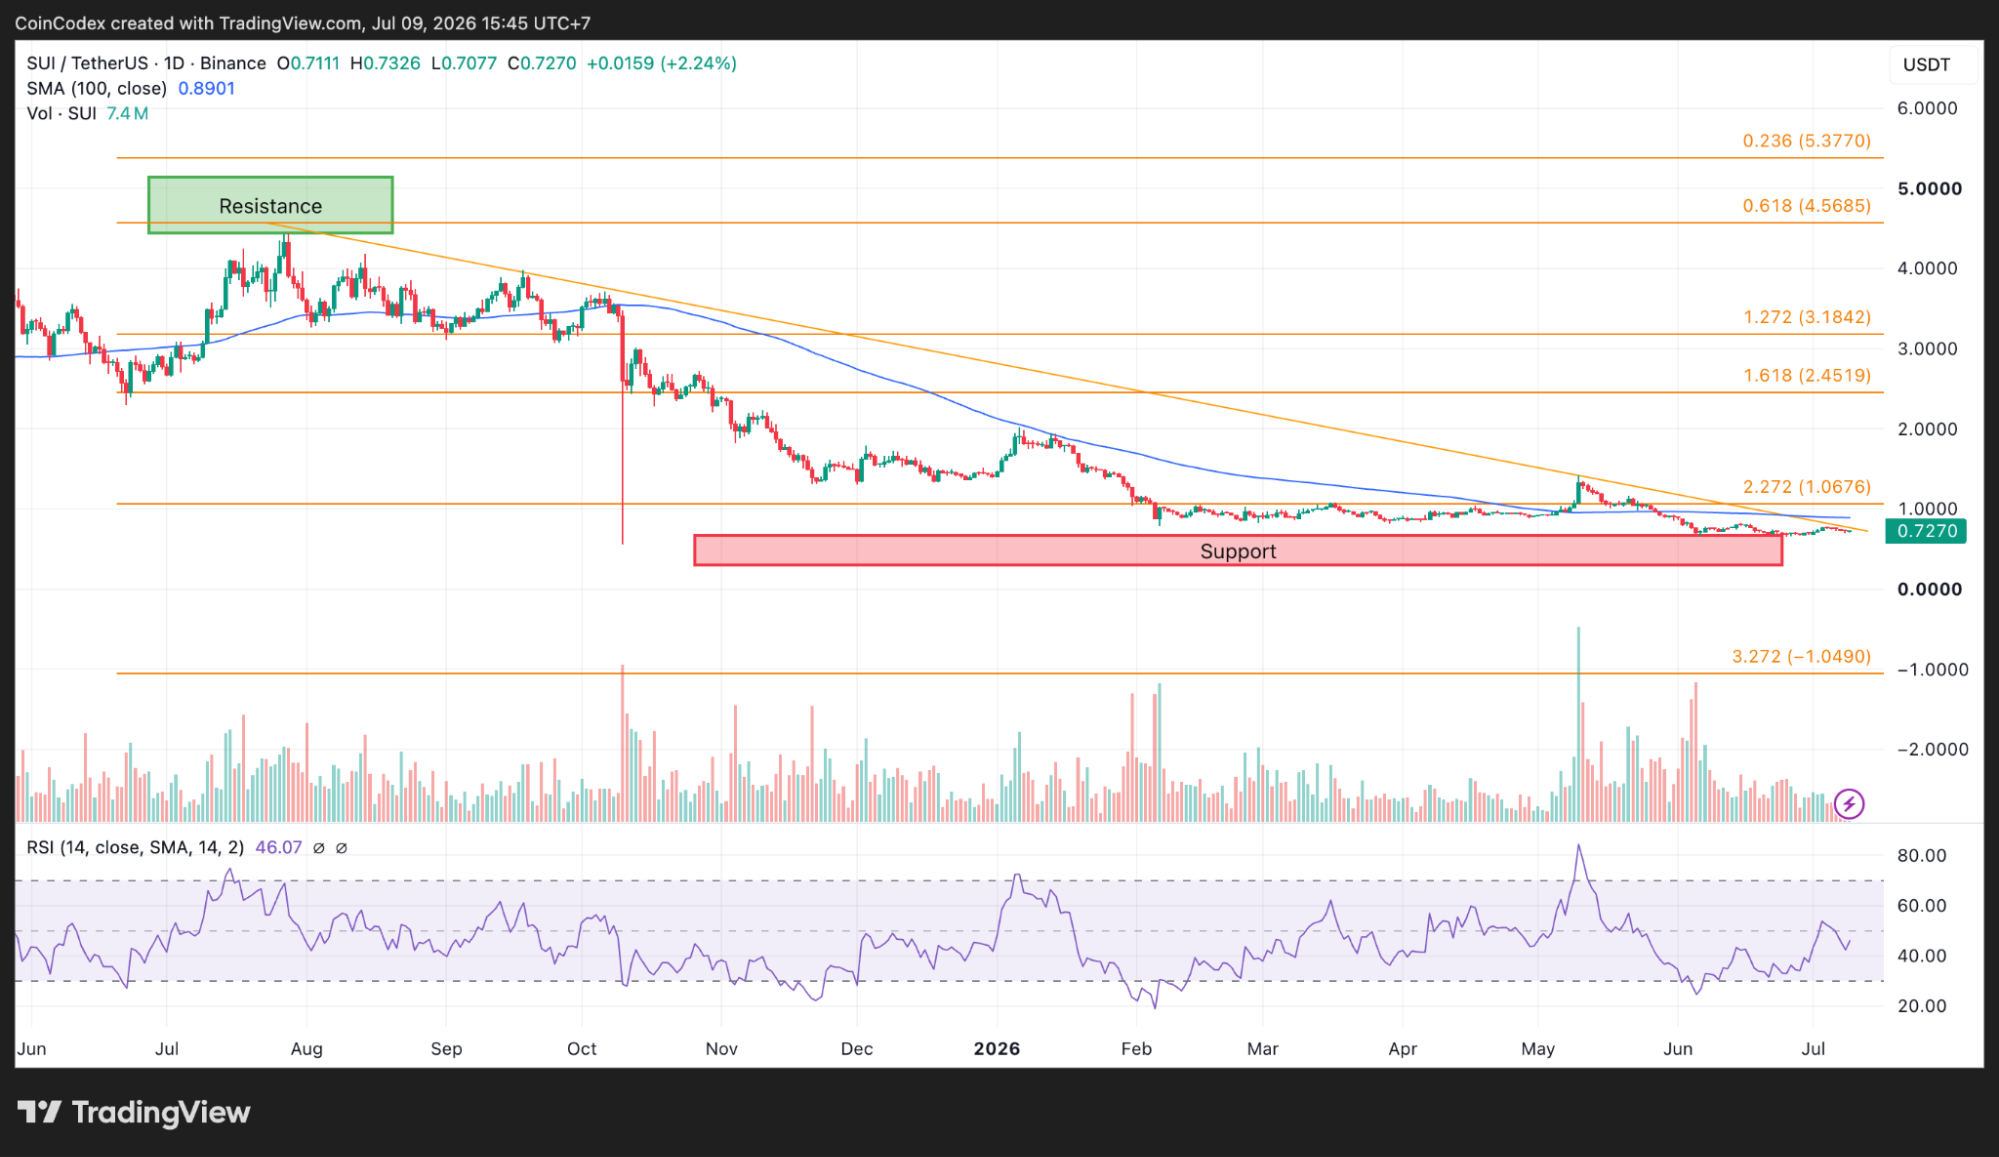
We also reviewed Sui's native daily and 4-hour charts, and the picture is becoming a little more constructive. On the daily chart, the SUI price is at approximately $0.73, which is 18% under its 100-day simple moving average of $0.89. This indicates that the prevailing trend is indeed bearish, given the 86.5% decrease from last year's peak of $5.38.
Daily SUI chart analysis
Even so, momentum is beginning to improve. The daily RSI stands at 46.07, still below the neutral 50 level but producing higher lows even as price continued recording lower lows. That bullish divergence often appears when downside momentum starts fading.
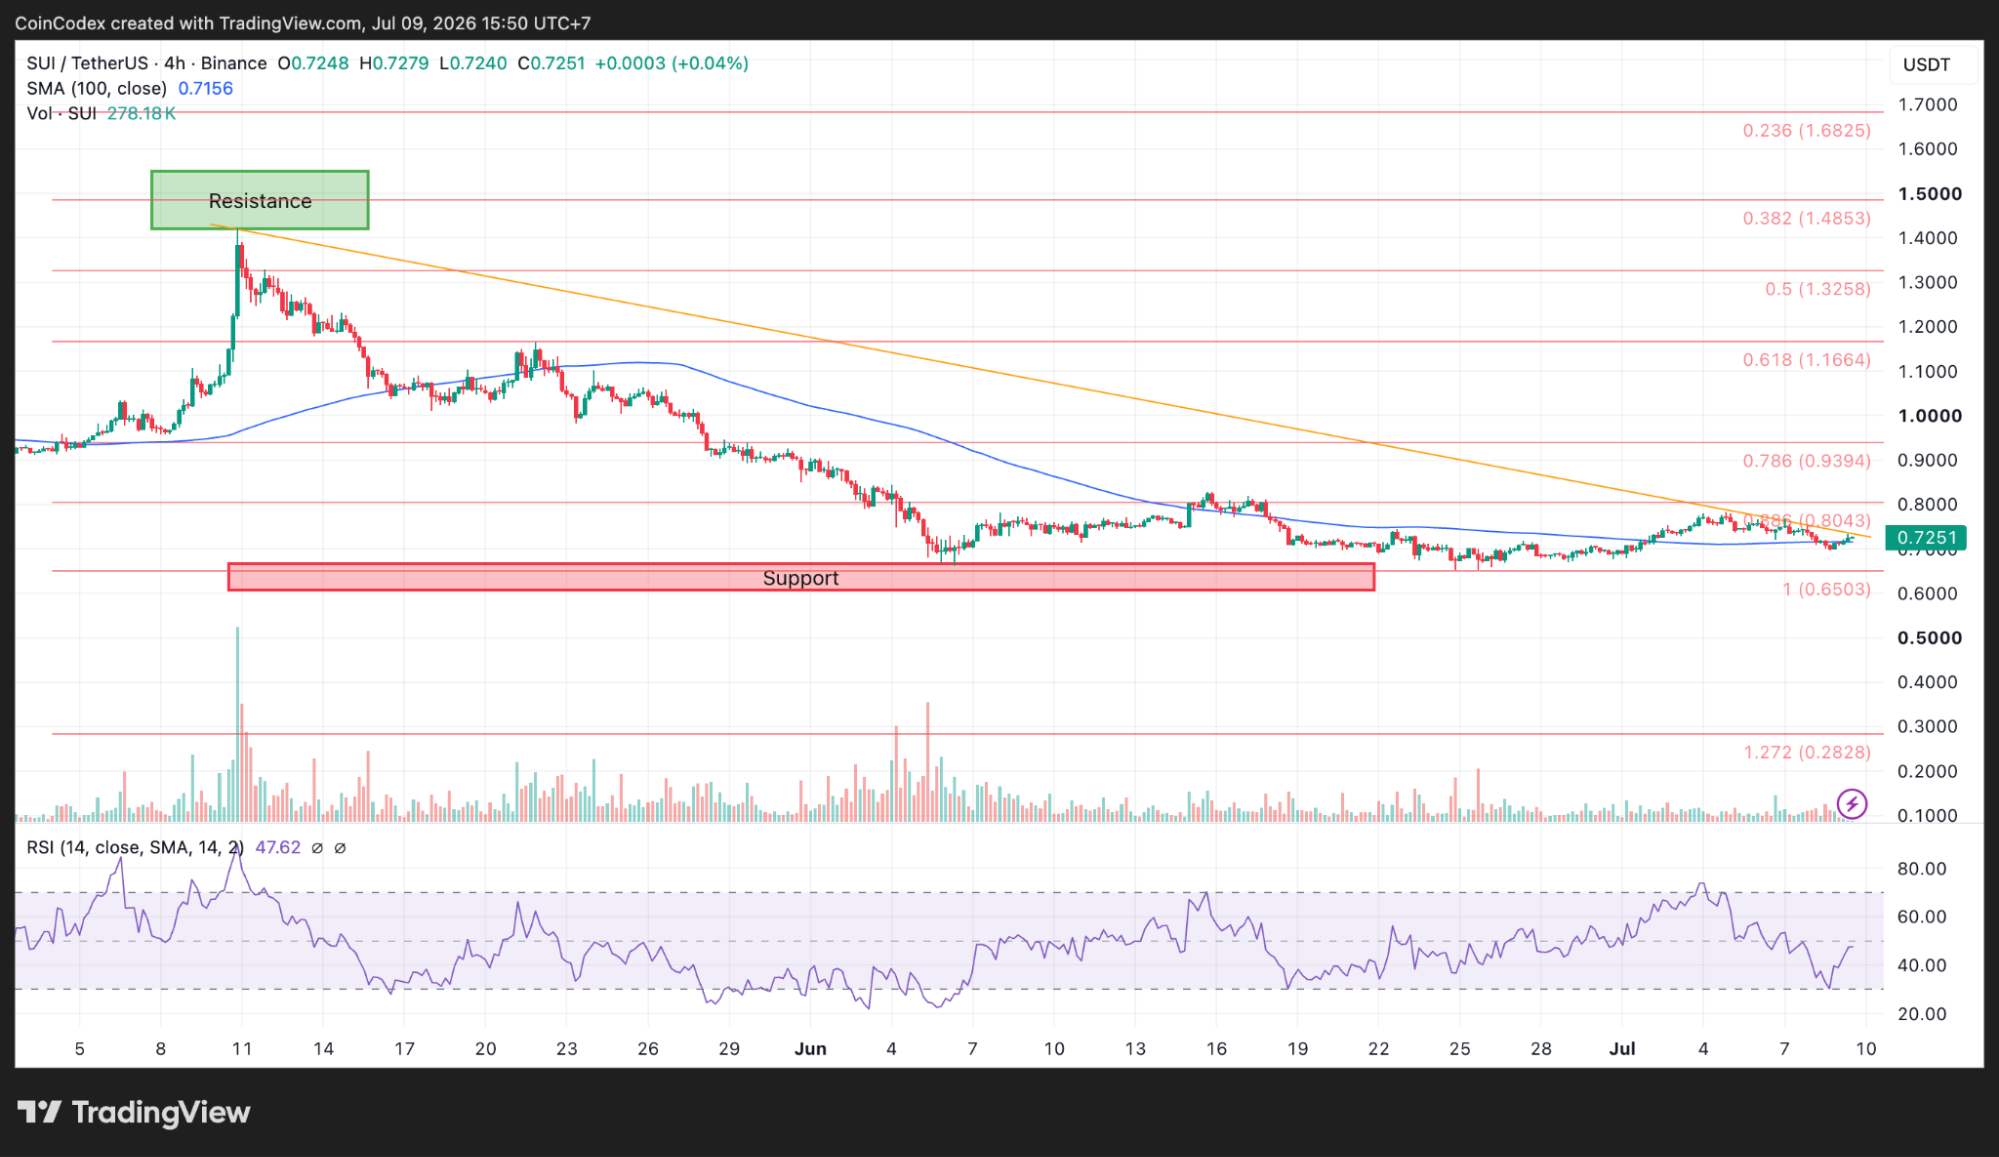
We had a look at the lower timeframe as well, and buyers are defending an important level. SUI price is now trading slightly above the 4-hour 100-period moving average of $0.7156 and RSI at 47.62.
4-hour SUI chart analysis
Both technical indicators do not confirm a reversal in trend but signal that selling momentum is now weakening. The first resistance zone can be seen at $0.80 before rising further to $0.89, which is the daily moving average. Clearing these levels would boost the possibility of a bigger rebound to $1.02.
The SUI market cap has pulled back
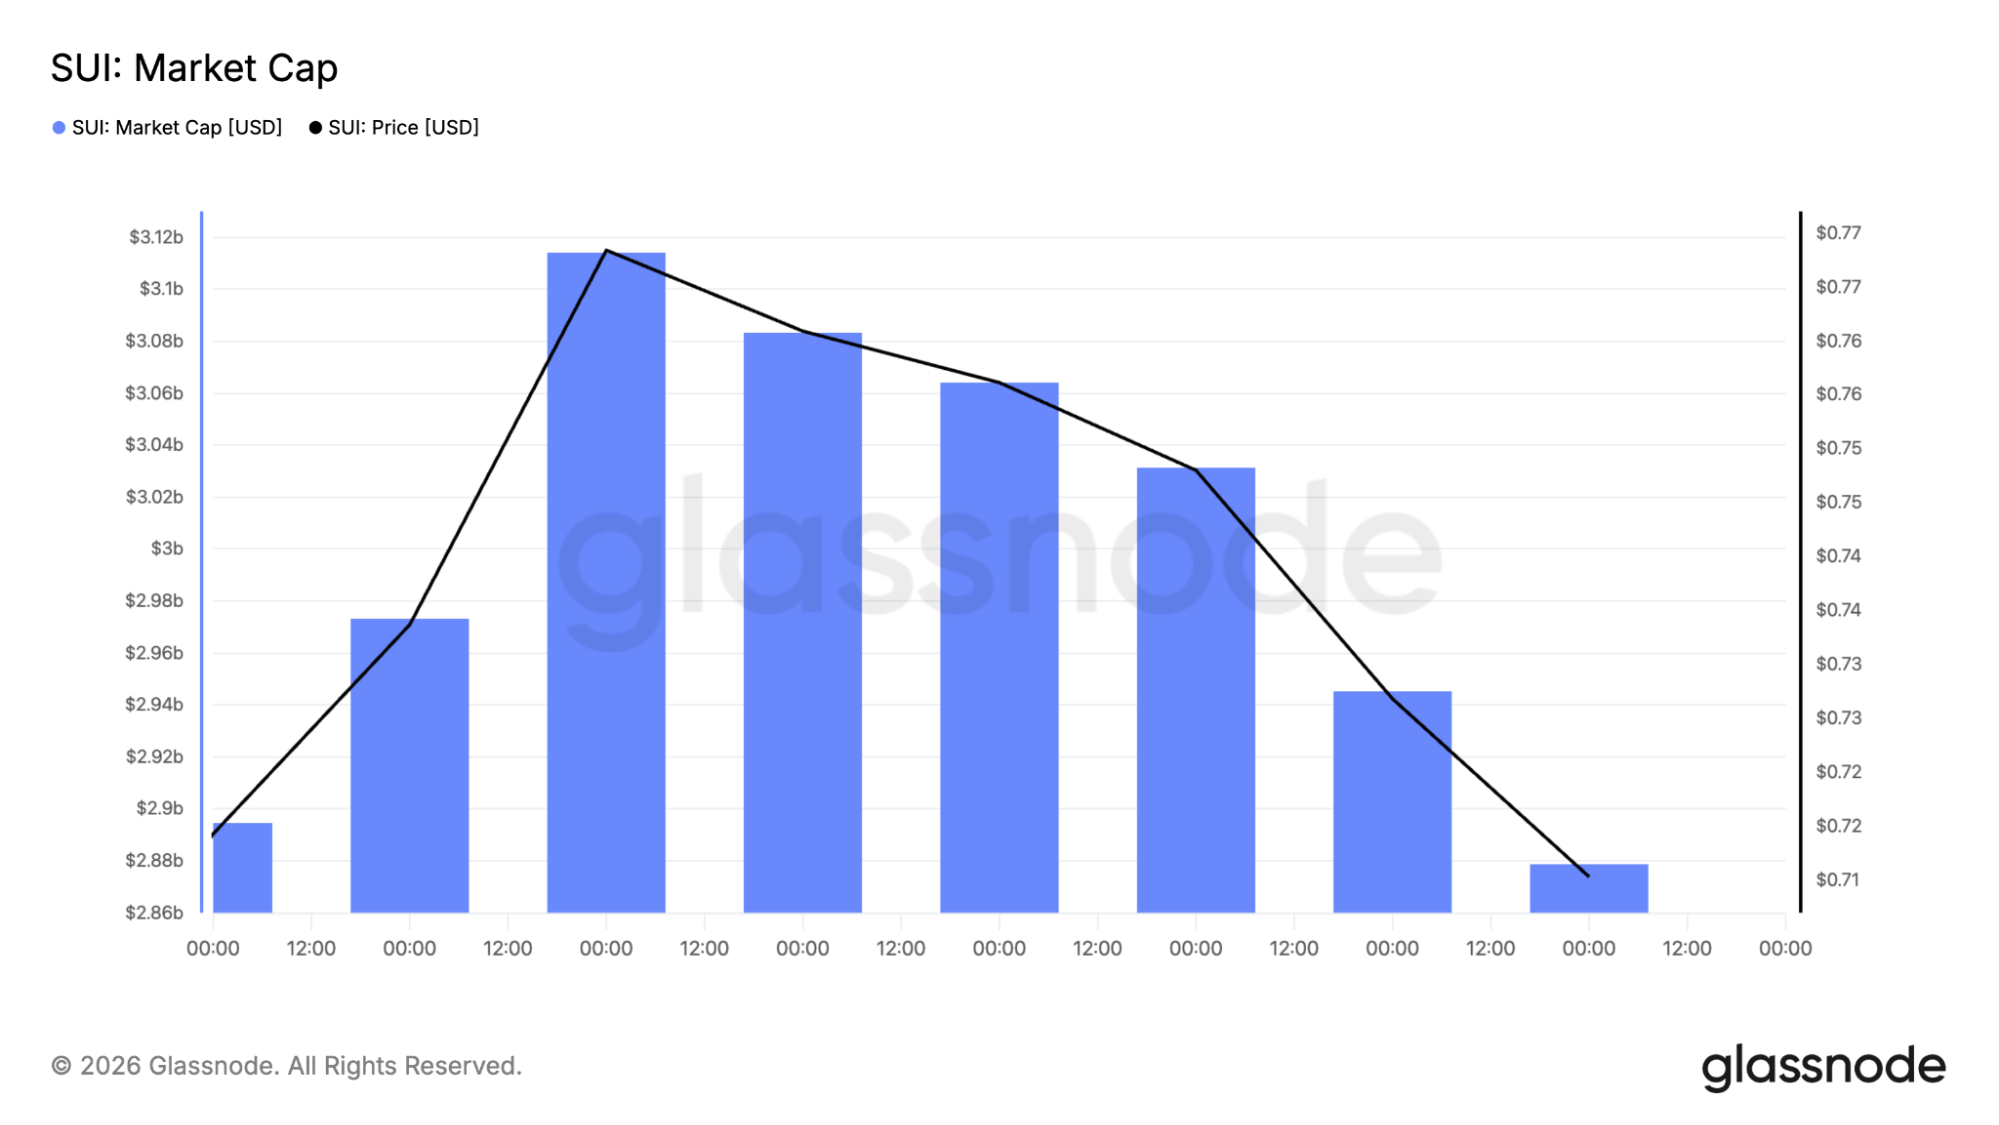
On-chain data from Glassnode shows some interesting results, too. In the time frame under discussion, the market capitalization of Sui fell from around $3.12 billion to $2.86 billion, representing an 8.3% decrease. The price of SUI fell from around $0.77 to $0.71 within that period, indicating that money is still flowing out of the network.
Another chart tracking the drawdown from Sui's all-time high shows improving recovery percentages, although the figures displayed don't fully match the token's actual price history. Based on Sui's peak near $25, the current trading range represents a much deeper decline than the chart indicates.
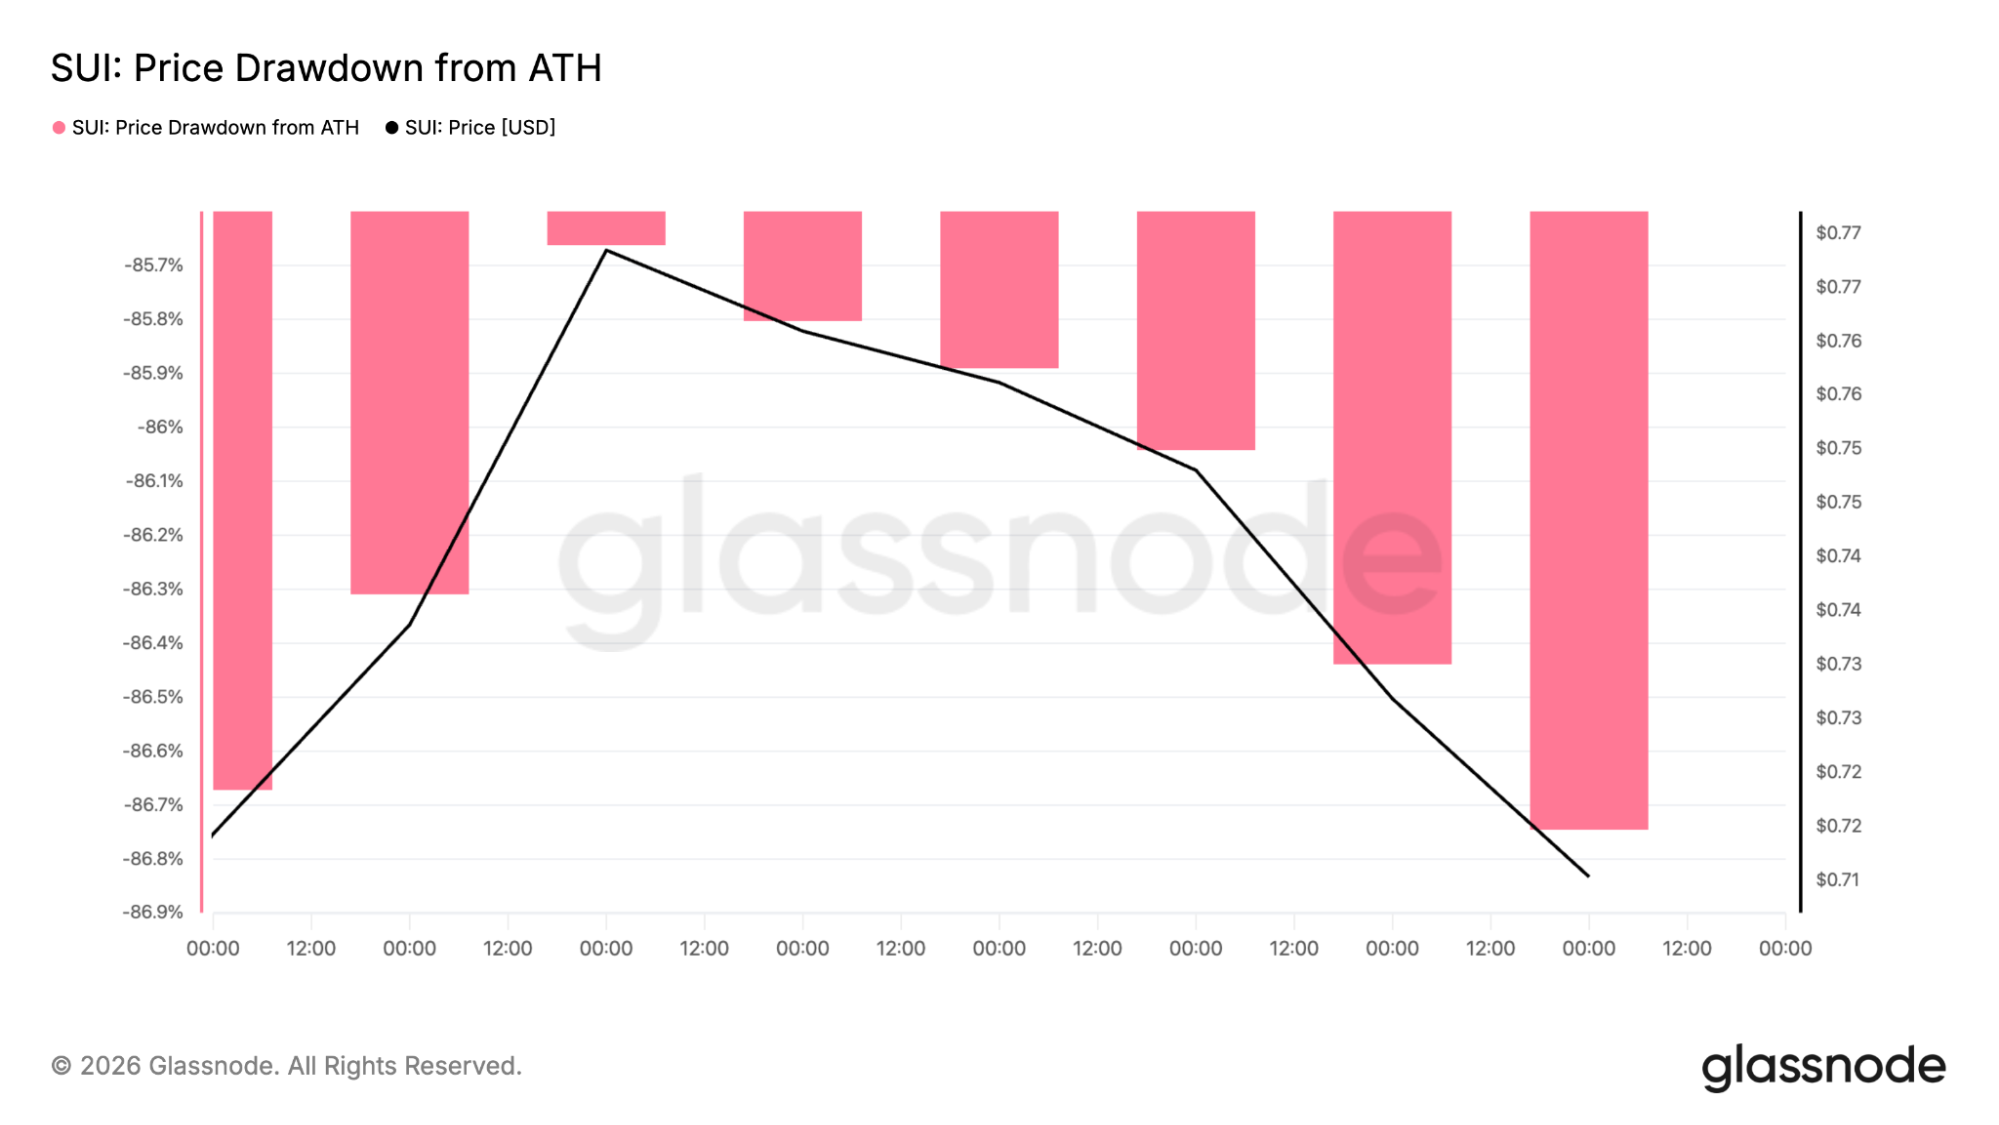
Even with that discrepancy, the broader takeaway remains the same. Market cap has weakened over the short term, but the pace of the decline has slowed compared to previous selloffs.
Could the Bitwise ETF filing change the narrative?
Away from the charts, Bitwise has submitted an S-1 registration statement to the SEC for a spot SUI ETF. The filing is just the initial step in the approval process. The SEC will examine the application, demand any changes needed, and ultimately determine if the product is viable.
In case of approval, the ETF will give investors access to SUI via regular brokerage accounts without having to worry about wallets or tokens at all. It would also place Sui alongside digital assets that are seeking broader institutional access through regulated investment products.
That doesn't guarantee immediate buying pressure, but it does increase Sui's visibility within the expanding crypto ETF market. The next milestones will be SEC feedback, any amendments to the filing, and the agency's final decision.
What comes next for the SUI price?
The next move depends on whether buyers can continue defending support. Holding the $0.50-$0.65 Fibonacci zone keeps the recovery scenario alive. If buyers can reclaim $0.80, attention moves toward the 100-day moving average near $0.89, followed by $1.02 and then $1.71.
If support fails, traders will be watching $0.50 as the final major support level identified on the chart before the correction could extend further. CoinCodex's 1-month SUI price prediction places the price at $0.5332, pointing to limited upside from current levels unless buyers can defend the $0.50-$0.65 support zone and reclaim resistance around $0.80 before targeting $1.02.
For now, the SUI price remains below its key long-term resistance levels, but improving RSI readings, support holding inside a major Fibonacci zone, and Bitwise's ETF filing give bulls several reasons to watch the next few trading sessions closely.


You May Also Like

Vertiport Infrastructure, Not Aircraft Certification, Seen as Primary Barrier to eVTOL Deployment

Solana (SOL) FUD Hits 2026 High: Why It Could Be a Bullish Twist

British Pound Recovery Tests Key Resistance Against US Dollar, Scotiabank Says



