

XRP Price Prediction: Can the $13 Target Survive XRP ETF Outflows?
$XRP is sitting near $1.09 today, and the coin is once again caught between two very different stories. One chart points to a bold long-term target near $13. The other shows fresh money leaving funds right now.
Let's discuss the XRP Price Prediction.
What is the XRP price today?
The altcoin trades around $1.09, down slightly over the past 24 hours. The token's market cap sits near $68.23 billion, with open interest in futures at $2.34 billion, up 0.73% on the day.
Spot volume over 24 hours came in at $333.71 million, while futures volume hit $1.95 billion. That gap tells a simple story. Right now, traders are more active in leveraged bets than in actual spot buying.
Is XRP forming a double bottom on the monthly chart?
A widely shared chart from crypto analyst EGRAG points to a familiar pattern. It shows the altcoin building a double bottom below what the analyst calls the "Super Guppy," a cluster of moving averages used to track macro trend direction.
The idea is not new. The altcoin has formed similar bottom patterns before earlier cycle expansions. According to the shared roadmap, the projected path includes several fib-based levels:
|
Fib Level |
Price Target |
|
Early reclaim zone |
$1.42 |
|
Major macro resistance |
$3.59 |
|
Expansion zone |
$5.41–$6.69 |
|
Fib 1.618 |
$9.09 |
|
Upper projection |
$13.82 |
The analyst is careful to frame this as a long-term projection, not a quick move. The message stresses patience, noting that past bottom formations took months, sometimes years, to fully play out.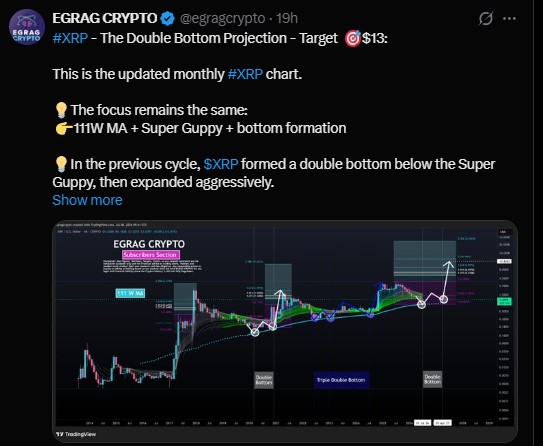
Why are XRP futures traders leaning short?
Liquidation data tells a mixed story depending on the timeframe. Over the past hour, shorts took the bigger hit, losing $44.43K compared to zero on the long side.
But zoom out to four hours, and the picture flips hard. Longs lost $65.61K while shorts got wrecked for $563.11K.
That trend held over 24 hours too, with $3.09 million in long liquidations against $883.17K in short liquidations.
In plain terms, more long positions have been forced closed lately. That usually happens when price drops and traders betting on a rise get stopped out.
Exchange data adds more nuance. Binance's XRP/USDT long/short account ratio sits at 2.8081, meaning far more accounts hold long positions than short.
Binance's top traders show an even higher ratio of 3.279 by account count, and 1.6055 by position size. OKX shows a similar lean, with a ratio of 2.93.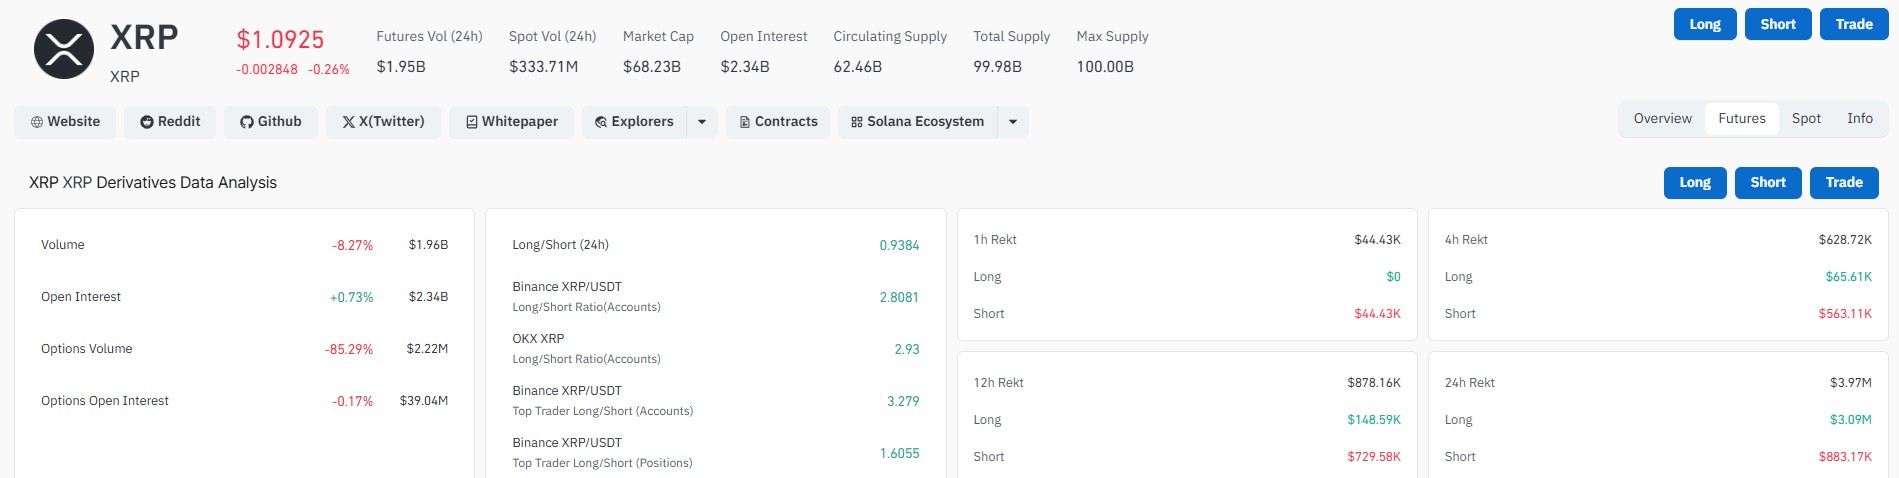
So retail accounts remain heavily long on paper, even as the market grinds sideways to lower.
XPR News Today: What is happening with XRP ETF flows?
Spot ETFs recorded a net outflow of $7.29 million, based on SoSoValue tracking.
That breaks a streak of positive weeks noted in other recent reports, where ETFs had logged eight straight weeks of inflows totaling around $1.49 billion cumulative.
One outflow week does not undo months of steady inflows. But it does raise a question. If institutional demand cools even briefly, does that weaken the case for a fast move toward the fib targets outlined above?
What other XRP news could move the price?
A few developments are shaping sentiment beyond the charts.
The XRP Ledger's v3.2.0 upgrade has crossed a key threshold, with more than 55% of trusted validators now running the new software.
The upgrade brings infrastructure fixes and developer tools. Full activation still needs over 80% validator approval held for two straight weeks.
Tokenized real-world assets on the XRP Ledger have grown sharply, jumping from $150 million to more than $4 billion in a year, according to data from Evernorth.
New wallet growth is up 40% weekly, and more than 500 tokenized products are now live on the network.
That said, the number needs context. Roughly $2.2 billion of that total sits in a single energy token held by just 19 wallets.
Only about $385 million is genuinely held on-chain and actively traded. The rest functions more like a registry entry than a live, liquid market.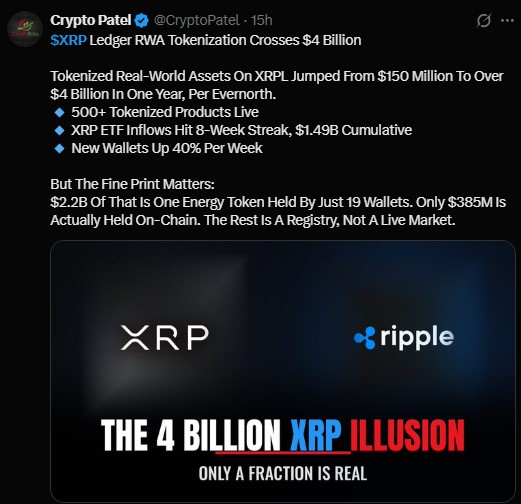
What are the key support and resistance levels for XRP right now?
Short-term technical readings show $XRP consolidating in a tight band. The $1 level remains the line in the sand. A close below that level on the daily chart would open the door toward the $0.80 zone, based on recent trading data.
On the upside, the $1.18 to $1.20 range is the zone bulls need to reclaim to shift momentum. Until either level breaks with conviction, $XRP looks stuck trading sideways.
Bottom line: Where does XRP go from here?
The $13 target represents a multi-year, best-case fib extension tied to a chart pattern, not a guaranteed outcome. It assumes the current bottom structure mirrors past cycles closely, and that macro conditions eventually turn supportive again.
Meanwhile, the near-term picture is choppier. A single week of ETF outflows, heavy long liquidations, and a market still fighting to hold $1 all suggest that any move toward the higher fib zones is, at best, a story for later in this cycle rather than this quarter.
Traders watching XRP right now may find the $1 to $1.20 range more relevant to near-term decisions than headline targets years out.
Disclaimer
This article is for informational purposes only and does not constitute financial, investment, or trading advice. Cryptocurrency markets are highly volatile, and prices can change rapidly. Past performance and chart-based projections do not guarantee future results. Always conduct your own research and consult a licensed financial advisor before making any investment decisions.


You May Also Like

Sony Ventures into US Stablecoin Market with New Trust Entity

Japonya Merkezli Sony Bank, ABD’de Dolar Destekli Stablecoin İhraç Etmeye Hazırlanıyor! İşte Detaylar

SpaceXAI Enters The AI Race With New Coding Model



