

ADA Declines 5.06% to $0.168 as Market Cap Reaches $6.24B
ADA Declines 5.06% to $0.168 as Market Cap Reaches $6.24B
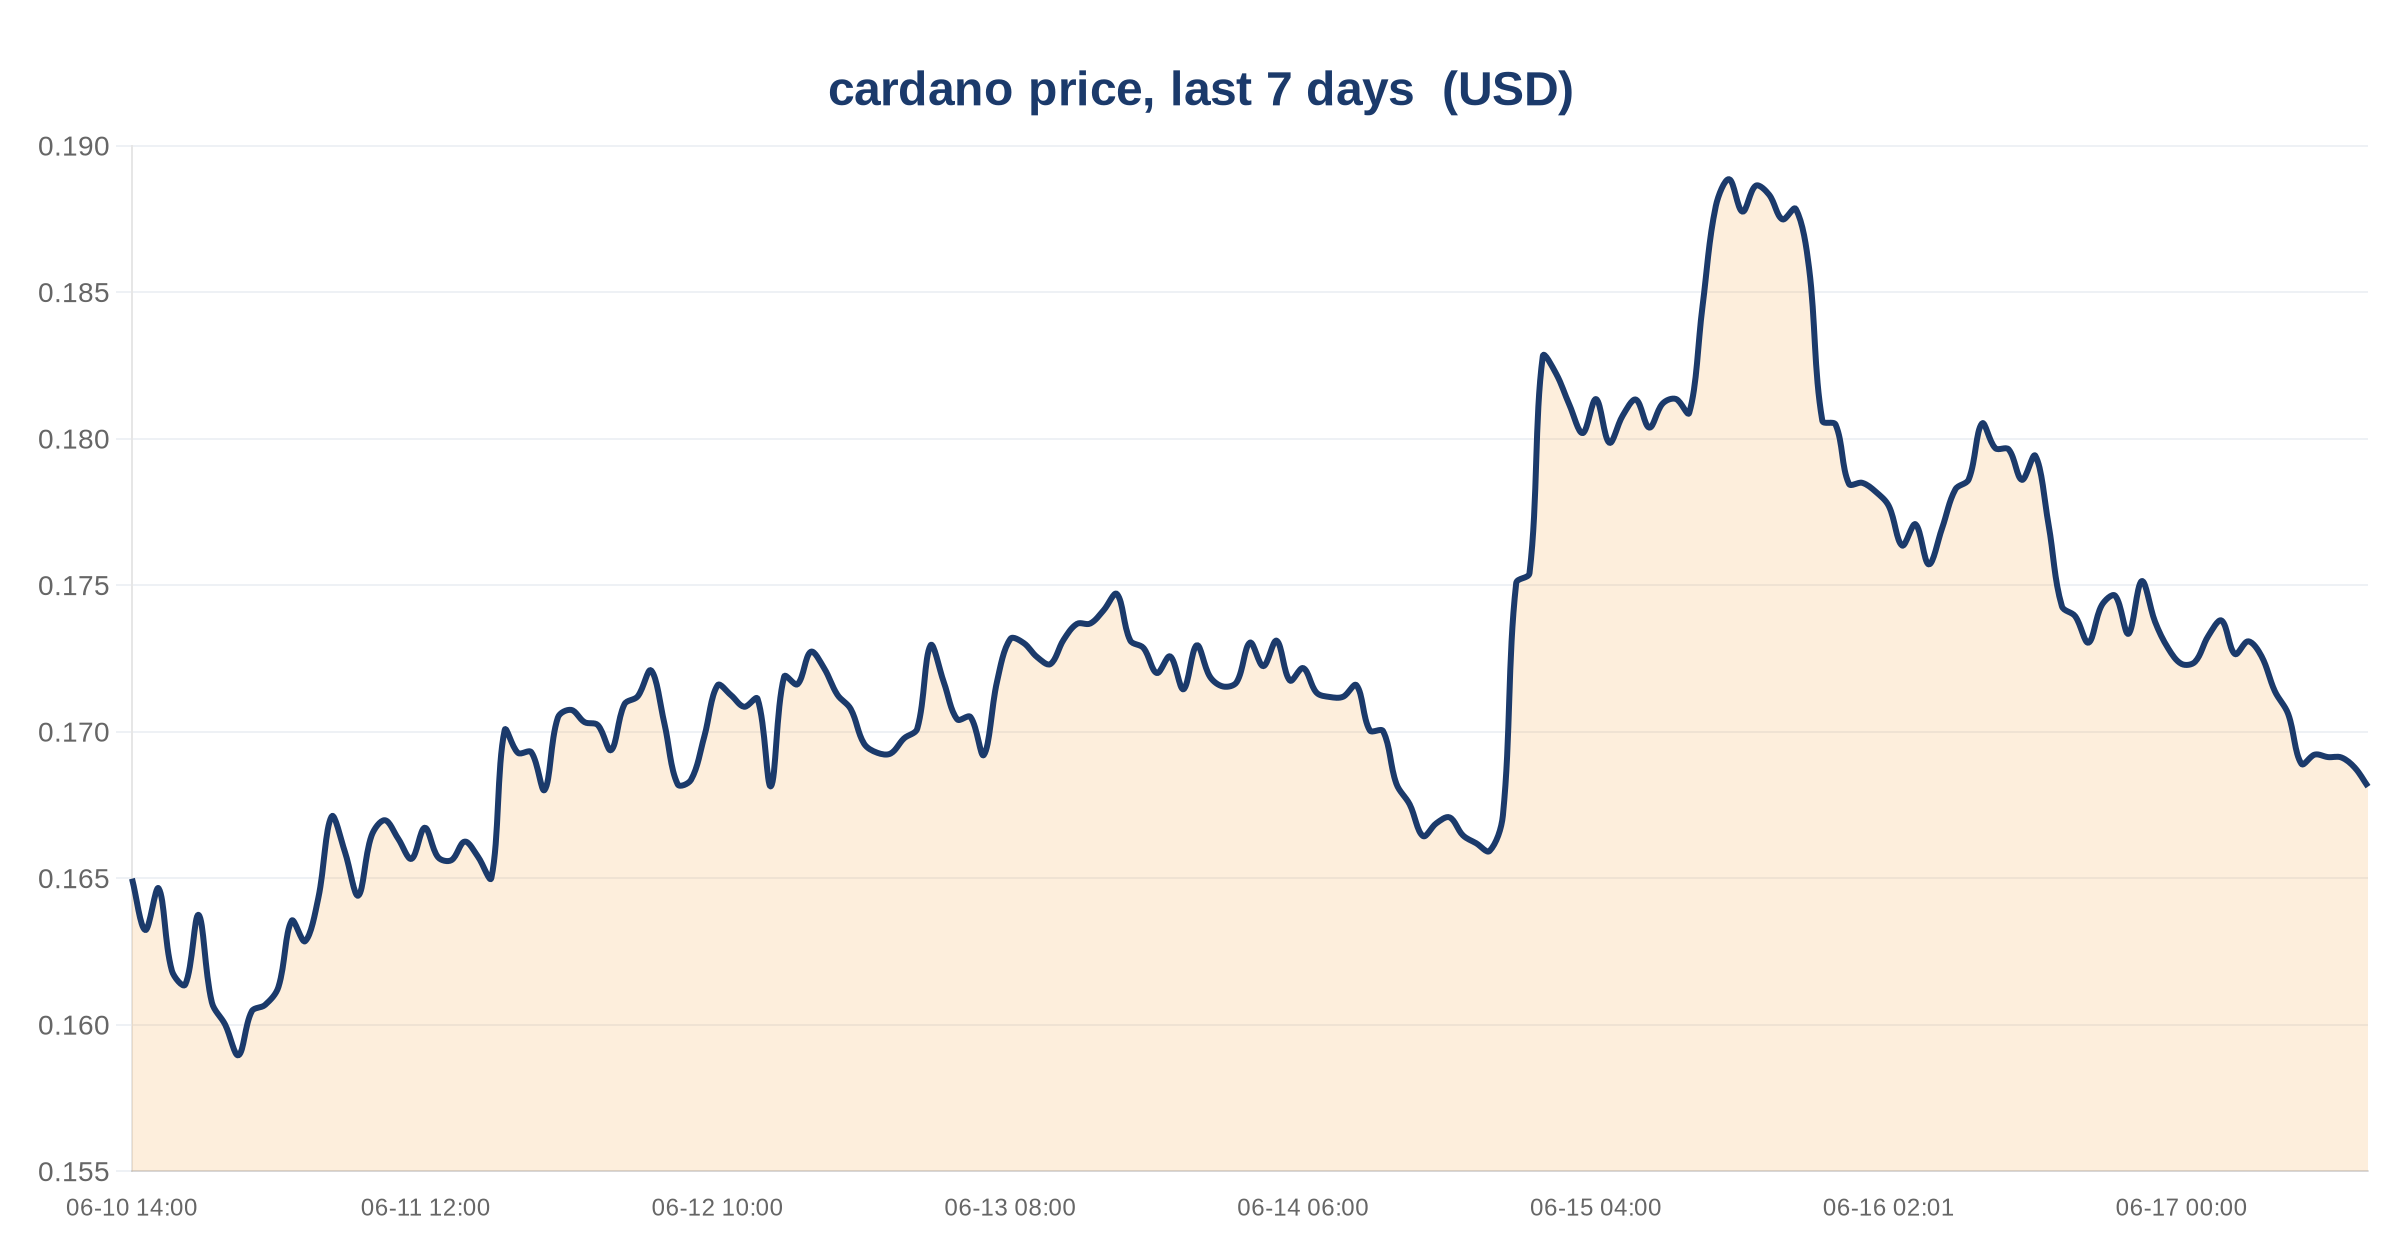
ADA was trading at $0.168 as of June 17, 2026, reflecting a decline of 5.06% over the prior 24-hour period. The move brought ADA’s market capitalization to $6.24 billion at the time of measurement.
Price and Market Cap at a Glance
The 24-hour price change of -5.06% placed ADA at $0.168 on June 17, 2026. Alongside that price level, ADA carried a market capitalization of $6.24 billion. Both figures were recorded at the same point in time, providing a snapshot of where the asset stood during that session.
The $0.168 price point and the accompanying $6.24 billion market capitalization represent the two primary data markers available for ADA on that date. The market capitalization figure is a product of the prevailing price and the circulating supply at the time of measurement.
Breaking Down the 24-Hour Move
A 24-hour decline of 5.06% brought ADA to its $0.168 level as of June 17, 2026. The move was recorded within a single trading day, capturing the extent of downward price action ADA experienced during that window.
The price of $0.168 and the 24-hour change of -5.06% are the figures on record for ADA as of the date in question. No intraday high, low, or volume figures were included in the available data for this report.
Market Capitalization Context
ADA’s market capitalization stood at $6.24 billion as of June 17, 2026. This figure was recorded alongside the $0.168 price and the -5.06% 24-hour movement. The market capitalization reflects the total dollar value attributed to ADA’s circulating supply at that price level on that date.
The three data points available for ADA on June 17, 2026 — price, 24-hour percentage change, and market capitalization — together constitute the complete picture of ADA’s market position as captured in this report. No additional trading metrics, historical comparisons, or project-level developments were included in the approved data set for this article.
Why It Matters
- ADA recorded a 24-hour price decline of 5.06%, landing at $0.168 as of June 17, 2026.
- The asset’s market capitalization was $6.24 billion at the time that price was recorded.
- Taken together, the price and market capitalization figures offer a point-in-time measure of ADA’s market valuation on that date.
- The 24-hour percentage change of -5.06% indicates the direction and magnitude of ADA’s price movement within that single trading day window.
As of June 17, 2026, ADA’s recorded price of $0.168, its 24-hour change of -5.06%, and its market capitalization of $6.24 billion are the figures on record. Updates to any of these metrics would require a new measurement at a subsequent point in time.
Disclaimer: Market data is informational only and not investment advice. Figures are accurate as of the stated dates and change continuously.
 On-chain data (sources linked above).
Featured illustration is AI-generated.


You May Also Like

Gold continues to hit new highs. How to invest in gold in the crypto market?

Bittensor Price Prediction: Where Could TAO Price Go If It Becomes the “AWS of Decentralized AI”?

3 Beaten-Down Stocks That Could Roar Back in June


