

Oracle Stock’s $553B Backlog Faces Its Biggest Test Wednesday

Oracle stock sits at a genuine inflection point ahead of Wednesday’s Q4 earnings. ORCL closed at $205.81 on June 9, well off its $220.50 session high, as AI-linked names sold off broadly. The daily chart is neutral, but intraday damage tells a more cautious story.
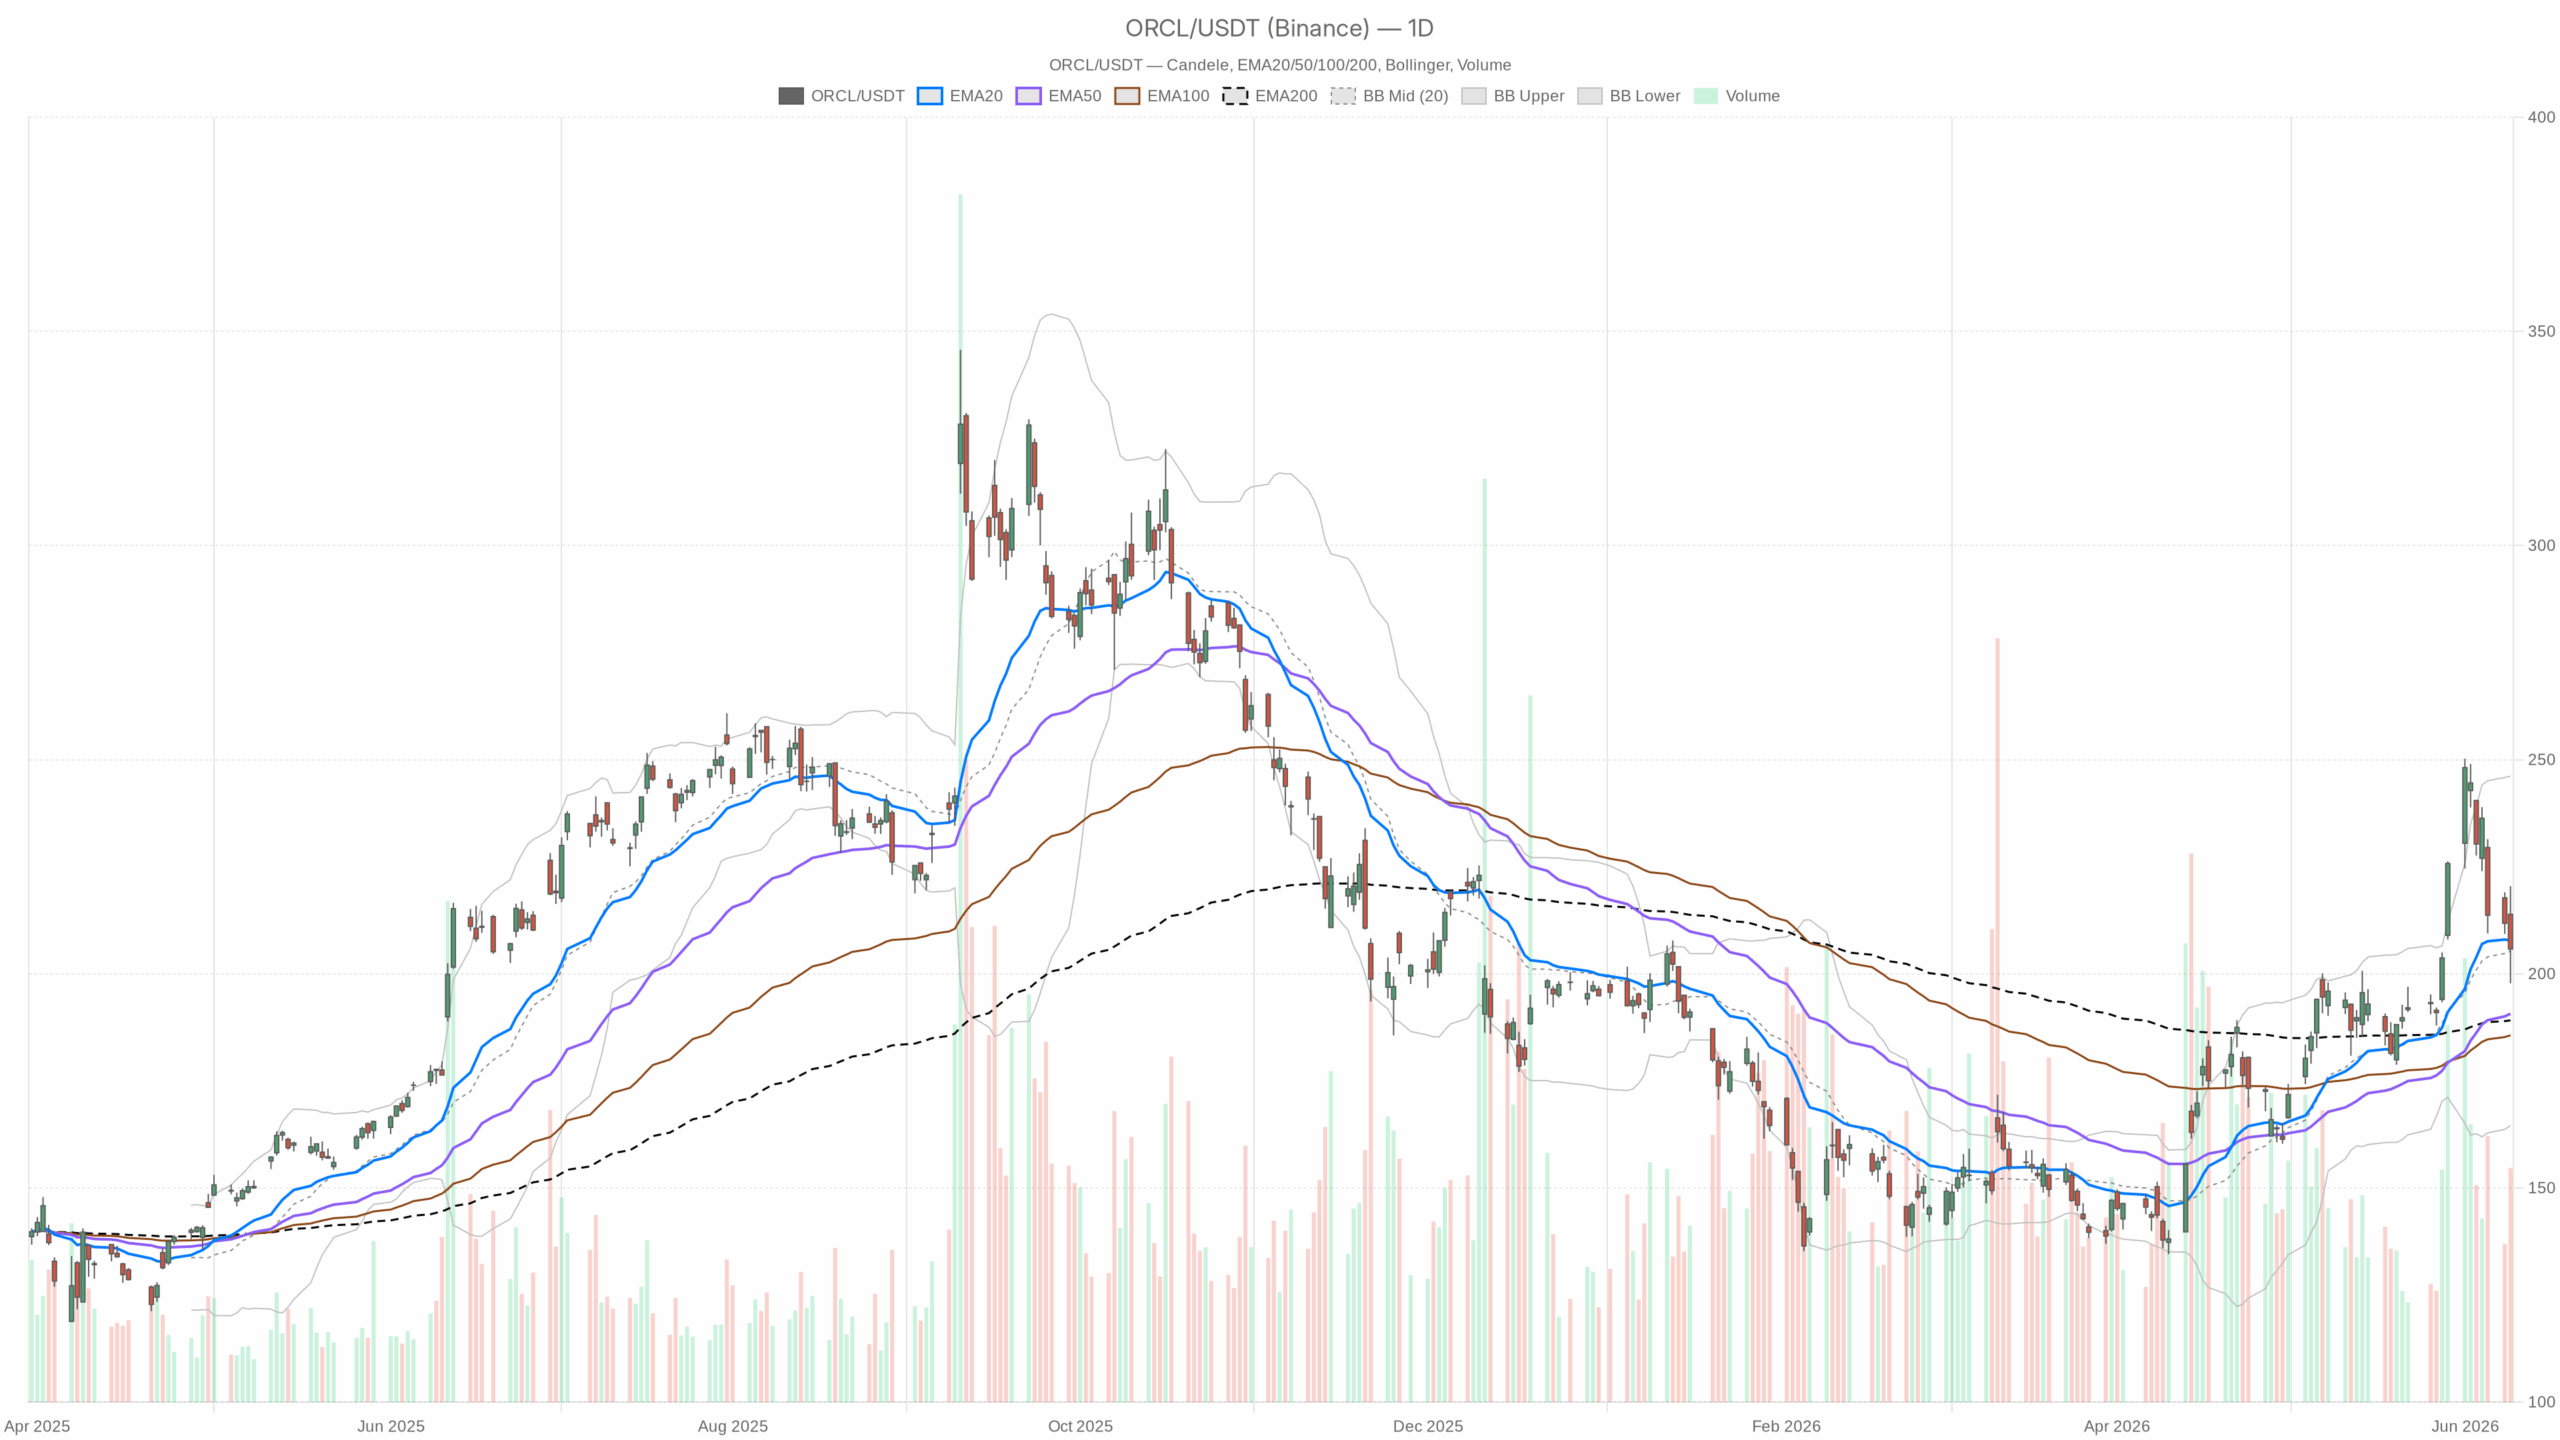 ORCL — daily chart with candlesticks, EMA20/EMA50 and volume.
Oracle Stock Daily Technical Structure
On the daily timeframe, ORCL remains above both its EMA50 at $190.69 and EMA200 at $189.14. That separation confirms the longer-term uptrend remains structurally intact. The recent pullback has not broken anything fundamental about the trend. However, the EMA20 at $207.80 sits just above the current close. This means short-term momentum has stalled. Price is threading a narrow gap between longer-term support and near-term resistance.
Momentum Indicators Flash Caution
The daily RSI at 51.65 reflects that ambiguity precisely. It is mid-range — not oversold, not overbought. There is no strong directional conviction in momentum right now. Meanwhile, the MACD tells a more cautious story. The line at 11.17 remains above zero, preserving the bullish structure. But the histogram has ticked negative at -0.97 as the signal line at 12.14 crosses above. That divergence suggests upside momentum is fading, even if the trend itself has not reversed.
Oracle Stock Volatility and Pivot Levels
Bollinger Bands on the daily are extremely wide. The upper band sits at $246.15, while the lower band rests at $164.59. This is the signature of a stock that has seen significant volatility recently. The current close near the midband at $205.37 reinforces the neutral regime. ATR at $13.98 underlines just how wide daily swings have become. Positioning around earnings in this environment carries real volatility risk.
The daily pivot structure places the pivot point at $208.03. Resistance R1 stands at $218.28, with support S1 at $195.57. The close at $205.81 is marginally below the pivot — a subtle bearish lean on a short-term basis. A recovery through $208 would restore neutral-to-bullish positioning. However, a failure toward $195.57 would open a more meaningful test of short-term demand.
Oracle Stock Intraday Weakness Deepens
Turning to the hourly chart, the picture weakens considerably. The 1H RSI at 35.46 is approaching oversold territory. This is a clear sign that intraday sellers dominated the June 9 session. The MACD on the hourly is deeply negative. The line reads -5.73, and the histogram remains negative at -0.27. Meanwhile, price at $205.75 sits well below the hourly EMA20 at $211.82 and EMA50 at $216.64. That overhead pressure is real and cannot be dismissed.
The hourly EMA200 at $200.38 offers a more constructive data point. It sits below current price and may act as a floor if selling continues. In contrast, the upper Bollinger Band on the 1H at $220.18 aligns with Monday’s intraday high. That reinforces the level as a ceiling. The hourly regime is tagged as neutral, but internal indicators lean bearish in the short term. Overall, the hourly view clearly complicates the daily thesis.
15-Minute Stabilization Offers Limited Relief
At the 15-minute level, a small but notable development has emerged. The MACD histogram has turned positive at 0.53, even as the MACD line remains negative at -1.32. That divergence suggests very short-term stabilization is underway around the $204–$206 range. The 15m RSI at 48.19 is neutral. This is not a reversal signal. Rather, it suggests immediate selling pressure may be pausing near the hourly pivot support at $204.12.
AI Rotation Rattles Oracle Stock Fundamentals
The fundamental backdrop is equally charged. Anthropic’s release of two advanced AI models triggered a sector-wide rotation on June 9. The new models — Claude Fable 5 and Claude Mythos 5 — pulled capital away from AI infrastructure names. Oracle, Palantir, and Workday all fell together. That kind of macro sentiment shift is indiscriminate. It does not distinguish between Oracle’s $553 billion RPO backlog or OCI’s 84% year-over-year growth. However, those fundamentals will matter again — especially with earnings arriving Wednesday.
Oracle Stock Bullish Earnings Scenario
The bullish scenario hinges on earnings confirming the cloud reacceleration story. OCI growth, strong RPO expansion, and any upward revision to full-year guidance could rapidly reframe the current pullback. It would transform the dip into a buying opportunity. In that case, a recovery through the daily pivot at $208.03 would be the first technical signal. A reclaim of the EMA20 at $207.80 would follow. Together, they would confirm bulls are regaining control. The logical target then becomes the $218–$220 zone — aligning with the R1 pivot and the intraday high.
Oracle Stock Bearish Case
The bearish case is more straightforward. If earnings disappoint, the hourly momentum structure provides no cushion. Margin pressure from heavy capex and restructuring costs could overshadow top-line growth. The stock is already trading below short-term moving averages. A break below $195.57 — the daily S1 pivot — would open a test of the EMA50 near $190.69. That level represents a more critical structural boundary. Below it, the longer-term bullish case begins to erode meaningfully.
Oracle Stock Outlook: Discipline Over Direction
Overall, ORCL enters its earnings window in a technically fragile but structurally unbroken state. The daily trend remains bullish at its foundation. However, intraday momentum is clearly under pressure. Volatility is elevated, the earnings binary is imminent, and sector sentiment has been rattled. Positioning here demands conviction in the fundamental story. It also demands respect for the range a $13.98 daily ATR can produce in either direction. This is not a moment for passive exposure — it is a moment for disciplined scenario planning.


You May Also Like

BTC Price Shaky Near $67K While Oil Surges on Middle East Tensions: What's Next? (April 2 Update)

One Of Frank Sinatra’s Most Famous Albums Is Back In The Spotlight

LIST: Bayanihan initiatives amid soaring oil prices


