

Zcash (ZEC) Rebounds 16% After Security Crisis — Is the Recovery Sustainable?
Key Takeaways
- A critical vulnerability in Zcash’s Orchard shielded pool, present since May 2022, sparked a major selloff when exposed in late May 2026
- An emergency soft fork on June 2 disabled the vulnerable feature, with the NU6.2 hard fork deploying the permanent fix one day later
- ZEC plummeted from approximately $629 to under $270 before staging a rebound to the $420 level
- Open Interest collapsed from roughly $800M to approximately $418M, indicating widespread leverage liquidations rather than organic selling
- Trader Vuori Trading maintains an unchanged outlook — critical resistance zones lie between $450–$500, with support holding at $390–$400
Zcash has staged a notable recovery of approximately 16%, reaching the $420 price point following one of its most dramatic declines in recent history. The swift downturn erased the majority of ZEC’s gains accumulated over several months in a matter of days.
 Zcash (ZEC) Price
The turmoil originated from the discovery of a counterfeiting exploit within Zcash’s Orchard shielded pool. This security flaw had existed undetected since May 2022 until Shielded Labs uncovered it during a routine audit conducted in late May 2026.
The severity of this vulnerability cannot be understated. Had malicious actors exploited it, they could have generated counterfeit ZEC tokens that would remain completely invisible to network validators, fundamentally undermining Zcash’s value proposition to its user base.
The development team responded swiftly to the threat. On June 2, they implemented an emergency soft fork to deactivate the Orchard pool functionality while ZEC was hovering near $587. Within 24 hours, the team deployed the NU6.2 hard fork containing a comprehensive solution to the vulnerability.
Market Reaction: Sharp Decline from $629 to $270
During the emergency patching process, ZEC experienced a brief surge to approximately $629. However, the market sentiment quickly deteriorated. The token cascaded through multiple support structures, ultimately finding a temporary floor near $270 on June 5.
The technical chart paints a vivid picture of the collapse. ZEC developed a head-and-shoulders pattern with a peak around $700, breached the critical $500 neckline support, and plunged into the $300 territory before demand returned.
Trader Vuori Trading shared a confident assessment during the downturn: “$ZEC plan has not changed despite this recent dump. They want you out!” This commentary suggested conviction that the fundamental thesis for ZEC remains valid despite the intense price volatility.
The futures market experienced severe deleveraging. Open Interest contracted dramatically from nearly $800 million to approximately $418 million, reflecting mass liquidations and position closures throughout the downturn.
Critical Price Zones Ahead
Funding rates demonstrated remarkable resilience throughout the chaos, maintaining relatively stable and marginally positive levels. This behavior indicates that market participants haven’t adopted an overwhelmingly pessimistic outlook, despite the violent shakeout.
Analyst Ardi observed that ZEC retraced to its April breakout zone around $250 and characterized the current price action as a relief bounce. His projection targets the $430–$480 resistance cluster as the next potential ceiling.
That said, Ardi cautioned that a breakdown below $350 could trigger another downward cascade.
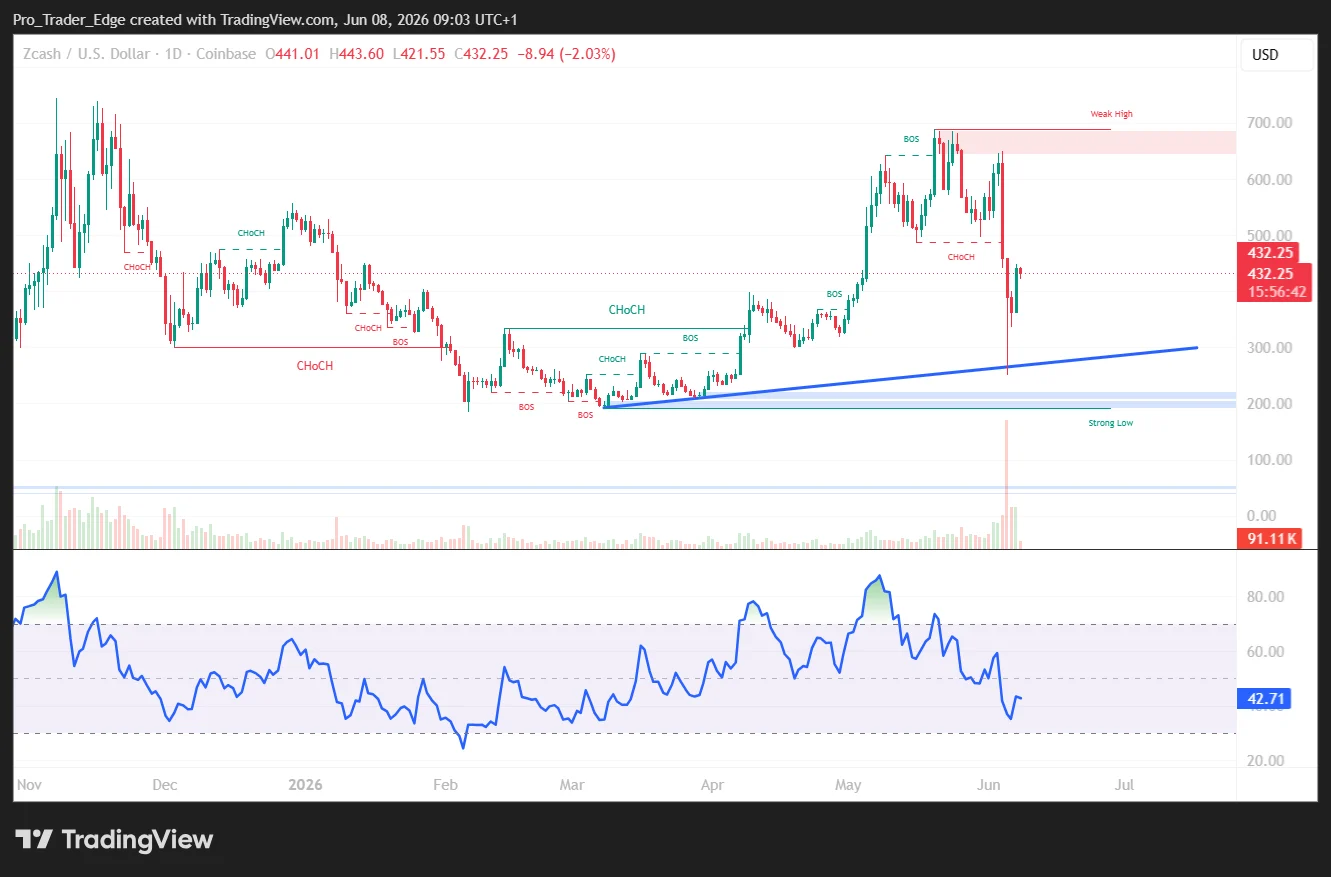 Source: TradingView
The Relative Strength Index is recovering from oversold territory but remains confined within a descending channel, leaving room for additional downside pressure. The Average Directional Index reads approximately 28.6, indicating that the next trending move could be forceful.
ZEC currently trades above its 200-day moving average. However, shorter timeframe moving averages remain in bearish alignment.
The $390–$400 range represents the critical battleground. Sustained trading above this zone supports the recovery narrative. A breakdown beneath it would bring $350 and subsequently the recent $304 low back into focus.
On the upside, initial resistance emerges near $450. A convincing breakout above this threshold would enhance the probability of an advance toward $550, with $650 representing the subsequent major hurdle beyond that level.
The post Zcash (ZEC) Rebounds 16% After Security Crisis — Is the Recovery Sustainable? appeared first on Blockonomi.


You May Also Like

MENA Fintech Association Expands SHIFT Payments Working Group with New Industry-Led Subcommittees

Forest Lake honors nationwide sales force at 12th National Convention following record 2025 growth

Syscoin pauses bridge after exploit mints 5 billion unauthorized SYS tokens


