The post Millions in IMX and XDC Leave Exchanges—Are Whales Preparing for a Big Rally? appeared first on Coinpedia Fintech News Immutable X (IMX) and XinFin’s XDCThe post Millions in IMX and XDC Leave Exchanges—Are Whales Preparing for a Big Rally? appeared first on Coinpedia Fintech News Immutable X (IMX) and XinFin’s XDC

Millions in IMX and XDC Leave Exchanges—Are Whales Preparing for a Big Rally?

2026/05/27 20:19
4 min read
For feedback or concerns regarding this content, please contact us at [email protected]
Story Highlights
  • IMX and XDC recorded their largest exchange outflows of 2026, signaling rising whale accumulation and reduced short-term selling pressure

  • Strengthening Web3 gaming and real-world asset narratives are helping IMX and XDC regain bullish momentum despite broader market volatility

Immutable X (IMX) and XinFin’s XDC Network are gaining renewed market attention as the Web3 gaming and real-world asset (RWA) narratives continue to strengthen across the crypto space. Both tokens have witnessed a notable rise in market activity and investor interest amid growing optimism surrounding blockchain gaming adoption and institutional-focused tokenization infrastructure.

Advertisement

Amid the rising momentum, onchain data reveals millions are exiting the platform, reducing the selling pressure on the token. Could this signal the beginning of a larger rally ahead, or is the market preparing for increased volatility in the coming sessions?

Million Exit from Altcoins Signaling Rising Whale Accumulation

According to the latest data shared by Santiment, Immutable X (IMX) and XinFin’s XDC Network recorded their biggest exchange outflows of 2026 within a single day. The platform reported net outflows of nearly 4.67 million IMX tokens and more than 10.38 million XDC tokens leaving exchange wallets, highlighting a sudden spike in whale activity.

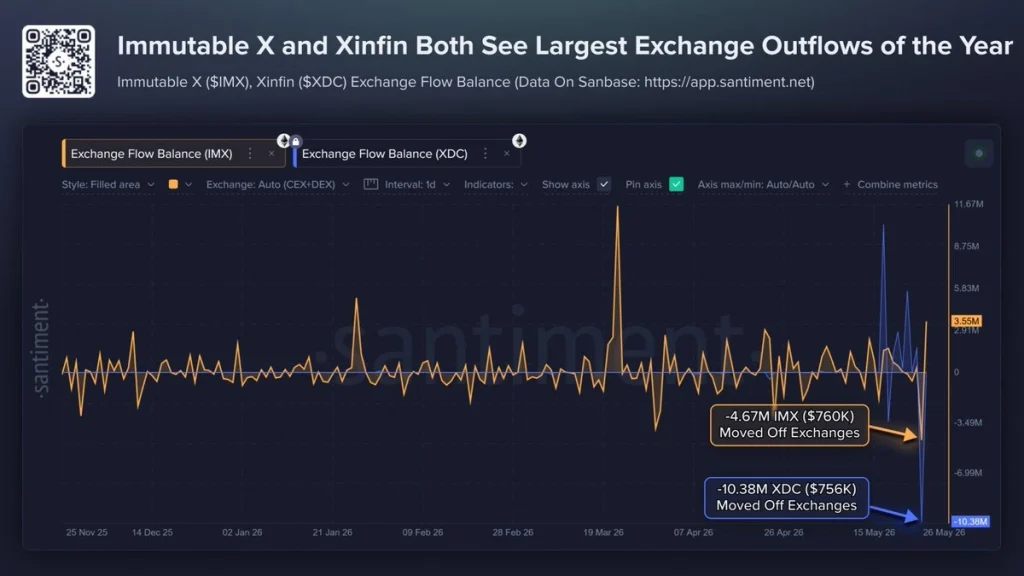
The sharp decline in exchange balances suggests that large holders may be moving tokens into private wallets or long-term custody solutions rather than keeping them readily available for selling. Historically, such exchange outflows are considered a bullish indicator because they reduce the immediate circulating supply on trading platforms and often reflect growing investor confidence.

IMX Price Holds Key Support Despite Short-Term Weakness

The daily chart suggests the Immutable X (IMX) price continues to trade within a broader ascending channel despite facing short-term selling pressure over the past few sessions. After a strong recovery from the April lows, the price has now pulled back toward the mid-range support zone near $0.16, where buyers appear to be attempting to regain control.

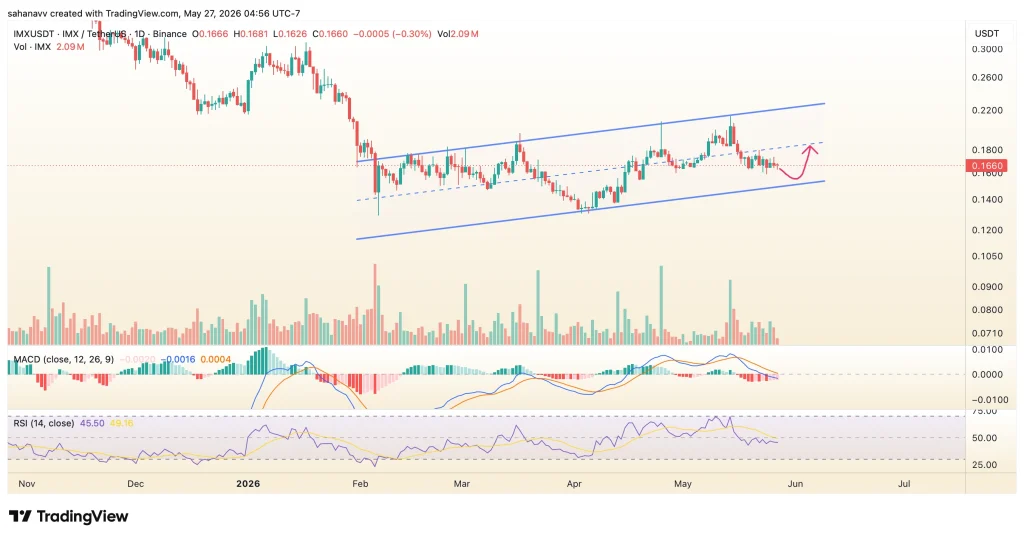
The recent decline has pushed the RSI back toward neutral levels, indicating that the overheated bullish momentum has cooled significantly. Meanwhile, the MACD remains under bearish pressure after witnessing a negative crossover, suggesting that the bulls still need stronger momentum to confirm a fresh recovery rally. However, the broader price structure continues to remain constructive as long as IMX sustains above the lower ascending trendline support.

A successful move above this range could open the doors for another rally toward the upper channel resistance near $0.18 to $0.22 in the coming sessions.

XDC Price Attempts Recovery After Breaking Key Downtrend Resistance

The daily chart suggests XDC Network price is attempting to recover after breaking above a long-standing descending trendline resistance that had capped the price action for several months. Following an extended downtrend, the token has started showing early signs of stabilization near the $0.029 support zone, while buyers continue attempting to build momentum above the short-term resistance levels.

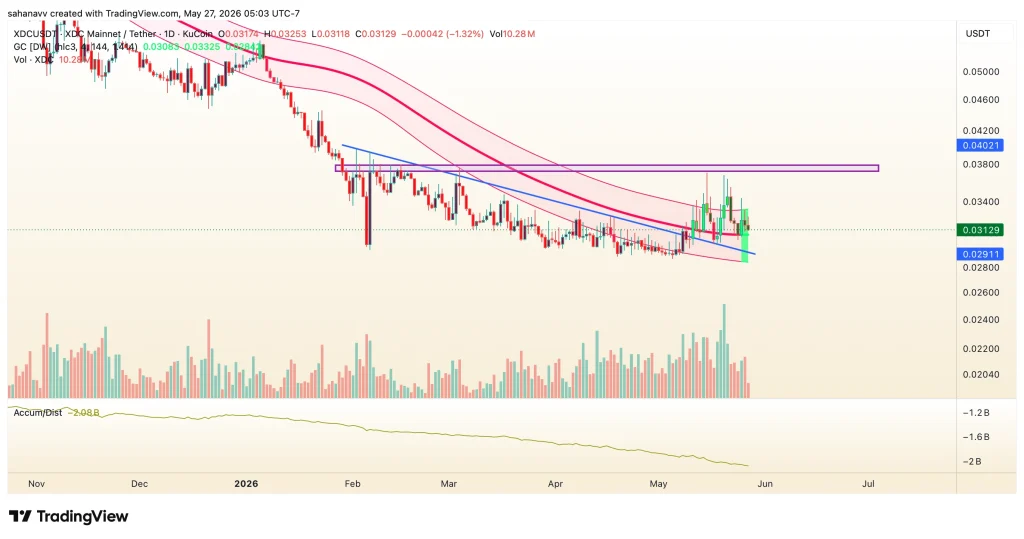
The price continues to face strong resistance near the $0.037 to $0.038 range, which aligns with a major supply zone and the upper resistance barrier highlighted on the chart. Meanwhile, the Gaussian Channel indicators still maintain a broader bearish structure, suggesting the bulls need sustained momentum to confirm a larger trend reversal. Despite the short-term volatility, the price structure appears to be gradually improving as XDC continues forming higher lows after reclaiming the descending resistance trendline. 

If the bulls manage to sustain above the $0.029 support and break past the overhead resistance zone, the token could witness a stronger recovery rally in the coming sessions.

Wrapping It Up—Are IMX and XDC Preparing for a Bigger Move?

Both IMX and XDC are showing early signs of accumulation as whales continue pulling large amounts of tokens off exchanges amid strengthening sector narratives. While IMX is benefiting from growing optimism around Web3 gaming, XDC continues gaining traction from the expanding real-world asset and enterprise blockchain narrative.

The improving technical structures and rising exchange outflows suggest investors may be positioning for a larger move ahead. However, both tokens still need to overcome crucial resistance zones before confirming a sustained bullish breakout in the coming sessions.

Market Opportunity
Immutable X Logo
Immutable X Price(IMX)
$0.141
$0.141$0.141
+3.14%
USD
Immutable X (IMX) Live Price Chart

World Cup Combo: Aim for 200x

World Cup Combo: Aim for 200xWorld Cup Combo: Aim for 200x

Combine up to 20 World Cup matches in one order

Disclaimer: The articles reposted on this site are sourced from public platforms and are provided for informational purposes only. They do not necessarily reflect the views of MEXC. All rights remain with the original authors. If you believe any content infringes on third-party rights, please contact [email protected] for removal. MEXC makes no guarantees regarding the accuracy, completeness, or timeliness of the content and is not responsible for any actions taken based on the information provided. The content does not constitute financial, legal, or other professional advice, nor should it be considered a recommendation or endorsement by MEXC.

You May Also Like

Daily XRP transfer volume surpasses 500 million! What does this mean during the latest price drop?

Daily XRP transfer volume surpasses 500 million! What does this mean during the latest price drop?

🚨 Daily transfer volume in $XRP just topped 500 million XRP. 📈 Network usage fully rebounded after a big selloff while price is still weak. 🛡️ Over 145,000 users
Share
COINTURK EN2026/06/19 21:08
Ethereum koers toont zeldzaam dubbel koopsignaal en richt zich op $4.550

Ethereum koers toont zeldzaam dubbel koopsignaal en richt zich op $4.550

Connect met Like-minded Crypto Enthusiasts! Connect op Discord! Check onze Discord   Ethereum laat op de uurgrafiek twee opeenvolgende TD Sequential koopsignalen zien. Deze indicator meet uitputting in een trend en geeft vaak een signaal dat de verkoopdruk kan afnemen. Dit dubbele signaal verschijnt rond het niveau van $4.516, waar de ETH prijs kortstondig steun vindt. Dit type formatie komt zelden voor en wordt daarom extra nauwlettend gevolgd. Wat gaat de Ethereum koers hiermee doen? Ethereum koers test steun rond $4.516 De scherpe daling van de Ethereum koers vanaf de prijszone rond $4.800 bracht de ETH prijs in korte tijd naar ongeveer $4.516. Op dit niveau trad duidelijke koopactiviteit op, waardoor de neerwaartse beweging tijdelijk werd gestopt. Het dubbele signaal dat door de TD Sequential indicator is gegenereerd, viel precies samen met dit prijspunt. De TD Sequential is opgebouwd uit negen candles die een trend meetellen. Wanneer de negende candle verschijnt, kan dit duiden op een trendomslag. In dit geval verschenen zelfs twee signalen kort na elkaar, wat aangeeft dat de verkoopdruk mogelijk uitgeput is. Het feit dat dit gebeurde in een zone waar ETH kopers actief bleven, maakt het patroon extra opvallend. TD Sequential just flashed two buy signals for Ethereum $ETH! pic.twitter.com/JPO8EhiEPi — Ali (@ali_charts) September 16, 2025 Welke crypto nu kopen?Lees onze uitgebreide gids en leer welke crypto nu kopen verstandig kan zijn! Welke crypto nu kopen? Fed-voorzitter Jerome Powell heeft aangekondigd dat de rentes binnenkort zomaar eens omlaag zouden kunnen gaan, en tegelijkertijd blijft BlackRock volop crypto kopen, en dus lijkt de markt klaar om te gaan stijgen. Eén vraag komt telkens terug: welke crypto moet je nu kopen? In dit artikel bespreken we de munten die… Continue reading Ethereum koers toont zeldzaam dubbel koopsignaal en richt zich op $4.550 document.addEventListener('DOMContentLoaded', function() { var screenWidth = window.innerWidth; var excerpts = document.querySelectorAll('.lees-ook-description'); excerpts.forEach(function(description) { var excerpt = description.getAttribute('data-description'); var wordLimit = screenWidth wordLimit) { var trimmedDescription = excerpt.split(' ').slice(0, wordLimit).join(' ') + '...'; description.textContent = trimmedDescription; } }); }); Technische indicatoren schetsen herstelkans voor ETH Naast de dubbele koopsignalen verstrekken ook andere indicatoren belangrijke aanwijzingen. Tijdens de daling van de ETH koers waren grote rode candles zichtbaar, maar na de test van $4.516 stabiliseerde de Ethereum koers. Dit wijst op een mogelijke verschuiving in het evenwicht tussen de bears en bulls. Als deze opwaartse beweging doorzet, liggen de eerste weerstanden rond $4.550. Daarboven wacht een sterkere zone rond $4.650. Deze niveaus zijn in eerdere Ethereum sessies al meerdere keren getest. Een doorbraak zou ruimte openen richting de all-time high van ETH rond $4.953. Wanneer de prijs toch opnieuw onder $4.516 zakt, liggen er zones rond $4.500 en $4.450 waar grotere kooporders worden verwacht. Deze niveaus kunnen als een vangnet fungeren, mocht de druk opnieuw toenemen. Marktdynamiek bevestigt technische indicatoren De huidige situatie volgt op een bredere correctie in de cryptomarkt. Verschillende vooraanstaande crypto tokens zagen scherpe koersdalingen, waarna traders op zoek gingen naar signalen voor een mogelijke ommekeer. Dat juist Ethereum nu een dubbel TD Sequential signaal toont, versterkt de interesse in dit scenario. Fundamenteel blijft Ethereum sterk. Het aantal ETH tokens dat via staking is vastgezet, blijft groeien. Dat verkleint de vrije circulatie en vermindert verkoopdruk. Tegelijk blijft het netwerk intensief gebruikt voor DeFi, NFT’s en stablecoins. Deze activiteiten zorgen voor een stabiele vraag naar ETH, ook wanneer de prijs tijdelijk onder druk staat. Fundamentele drijfveren achter de Ethereum koers De Ethereum koers wordt echter niet alleen bepaald door candles en patronen, maar ook door bredere factoren. Een stijgend percentage van de totale ETH supply staat vast in staking contracten. Hierdoor neemt de liquiditeit op exchanges af. Dit kan prijsschommelingen versterken wanneer er plotseling meer koopdruk ontstaat. Daarnaast is Ethereum nog steeds het grootste smart contract platform. Nieuwe standaarden zoals ERC-8004 en ontwikkelingen rond layer-2 oplossingen houden de activiteit hoog. Deze technologische vooruitgang kan de waardepropositie ondersteunen en zo indirect bijdragen aan een ETH prijsherstel. Het belang van de korte termijn dynamiek De komende handelsdagen zullen duidelijk maken of de bulls genoeg kracht hebben om door de weerstandszone rond $4.550 te breken. Voor de bears ligt de focus juist op het verdedigen van de prijsregio rond $4.516. De whales, die met grote handelsorders opereren, kunnen hierin een beslissende rol spelen. Het dubbele TD Sequential signaal blijft hoe dan ook een zeldzame gebeurtenis. Voor cryptoanalisten vormt het een objectief aanknopingspunt om de kracht van de huidige Ethereum trend te toetsen. Vooruitblik op de ETH koers Ethereum liet twee opeenvolgende TD Sequential signalen zien op de uurgrafiek, iets wat zelden voorkomt. Deze formatie viel samen met steun rond $4.516, waar de bulls actief werden. Als de Ethereum koers boven dit niveau blijft, kan er ruimte ontstaan richting $4.550 en mogelijk $4.650. Zakt de prijs toch opnieuw onder $4.516, dan komen $4.500 en $4.450 in beeld als nieuwe steunzones. De combinatie van zeldzame indicatoren en een sterke fundamentele basis maakt Ethereum interessant voor zowel technische als fundamentele analyses. Of de bulls het momentum echt kunnen overnemen, zal blijken zodra de Ethereum koers de eerstvolgende weerstanden opnieuw test. Koop je crypto via Best Wallet Best wallet is een topklasse crypto wallet waarmee je anoniem crypto kan kopen. Met meer dan 60 chains gesupport kan je al je main crypto coins aanschaffen via Best Wallet. Best wallet - betrouwbare en anonieme wallet Best wallet - betrouwbare en anonieme wallet Meer dan 60 chains beschikbaar voor alle crypto Vroege toegang tot nieuwe projecten Hoge staking belongingen Lage transactiekosten Best wallet review Koop nu via Best Wallet Let op: cryptocurrency is een zeer volatiele en ongereguleerde investering. Doe je eigen onderzoek. Het bericht Ethereum koers toont zeldzaam dubbel koopsignaal en richt zich op $4.550 is geschreven door Dirk van Haaster en verscheen als eerst op Bitcoinmagazine.nl.
Share
Coinstats2025/09/17 23:31
UK Gilt Yields Spike As Burnham Win Opens Door To Oust Starmer

UK Gilt Yields Spike As Burnham Win Opens Door To Oust Starmer

UK Gilt Yields Spike As Burnham Win Opens Door To Oust Starmer The odds of embattled UK Prime Minister Keir Starmer being ousted by the end of July
Share
ZeroHedge2026/06/19 21:05

Score Your Share of 50K USDT

Score Your Share of 50K USDTScore Your Share of 50K USDT

Complete DEX+ tasks to unlock the Champion Wheel