Solana Eyes Bullish Breakout if $98 Resistance Turns Into Support
Solana’s $98 resistance is in focus, with $88 as support and $107 to $117 as upside targets if SOL breaks out.
Solana traded near a key short-term barrier as market analysts focused on the $98 level.
A daily close above that area could turn resistance into support, while failure there may keep SOL within its recent range.
Solana Tests Key Channel Resistance
Solana has moved inside a defined trading channel since February. The lower boundary sits near $78, while the upper boundary stands near $98.
The $88 level has acted as the current pivot point. Price action around this area has helped define short-term direction.
SOL recently tested the $98 resistance area but faced a quick rejection. The token then showed signs of a bounce from lower levels.
Traders are now watching whether Solana can return to the channel top. A daily close above $98 may confirm a bullish breakout attempt.
If $98 turns into support, buyers may target $107 next. A stronger move could then open the way toward $117.
However, the setup remains range-bound until that close occurs. The $98 level remains the main short-term test for bulls.
Fibonacci Levels Show Overhead Supply
The visible Fibonacci range is drawn from about $106.56 to $255.39. SOL has already traded below that range.
The 0.786 retracement sits near $138.41. The 0.618 level is near $163.41, while the 0.5 level is near $180.97.
The 0.382 retracement is near $198.54. The 0.236 level stands around $220.27.
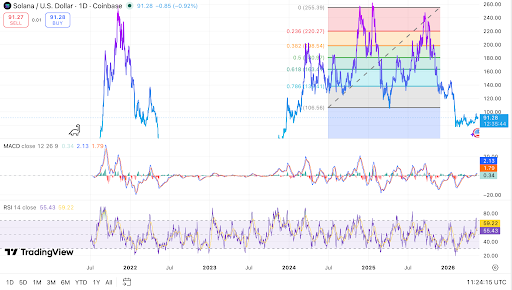 Solana tests $98 resistance as breakout confirmation builds. Source: TradingView.
The loss of the $138 to $140 area was a key technical event. That zone had acted as support during earlier trading periods.
After that level failed, Solana moved toward the $85 to $95 consolidation zone. Price now trades below the $106.56 Fibonacci range low.
This means the prior retracement structure has weakened. Until SOL reclaims $106 to $110, that area may act as supply.
The $106 to $110 range also aligns with former support. A move above it may show reduced selling pressure.
Read Also:
Momentum and Range Levels Guide Next Move
The daily MACD has started to improve. The MACD line is above the signal line, and the histogram is slightly positive.
This shows that short-term momentum has turned upward. Yet the move remains early and needs price confirmation.
The RSI is near 55.84, while its moving average is around 59.24. This places RSI in a neutral-to-slightly bullish area.
If RSI moves above 60 to 65, it may show stronger momentum. If it turns lower, attention may return to the $88 pivot.
The short-term Solana outlook depends on $98. A daily close above that level could support a move toward $107.
If buying continues, the next target may stand near $117. That level could act as another resistance area.
If $98 holds again, SOL may pull back toward $88. A deeper retreat could bring the $78 floor back into focus.
Immediate support remains near $85 to $88. A daily close below that area may raise the risk of further weakness.
Higher resistance remains at $125 to $140. The $138 to $140 zone remains a major former support area.
For now, Solana continues to trade below major higher-timeframe levels. The next daily close near $98 may decide the next move.
The post Solana Eyes Bullish Breakout if $98 Resistance Turns Into Support appeared first on Live Bitcoin News.


You May Also Like

Zero Outflows. $123M Locked. The Chainlink ETF Story Nobody Is Talking About
US Dollar Surges as Hawkish Fed Repricing Drives Breakout, Says ING