

Solana (SOL) Price: What the Charts and On-Chain Data Say About SOL in April
TLDR
- SOL is trading around $78–$82, struggling to hold above key support at $75–$78
- A $285 million hack on Drift Protocol is weighing on ecosystem confidence
- Solana’s TVL has fallen from $9 billion to roughly $5.5–$6 billion in recent weeks
- 1.40 million SOL (around $110 million) moved to exchanges in 72 hours, raising supply concerns
- SOL ETFs recorded a net weekly outflow of $5.24 million for a second straight week
Solana is under pressure after a series of negative developments hit the ecosystem in quick succession. The SOL price has dropped around 1.5%, trading between $78 and $82 at the time of writing.
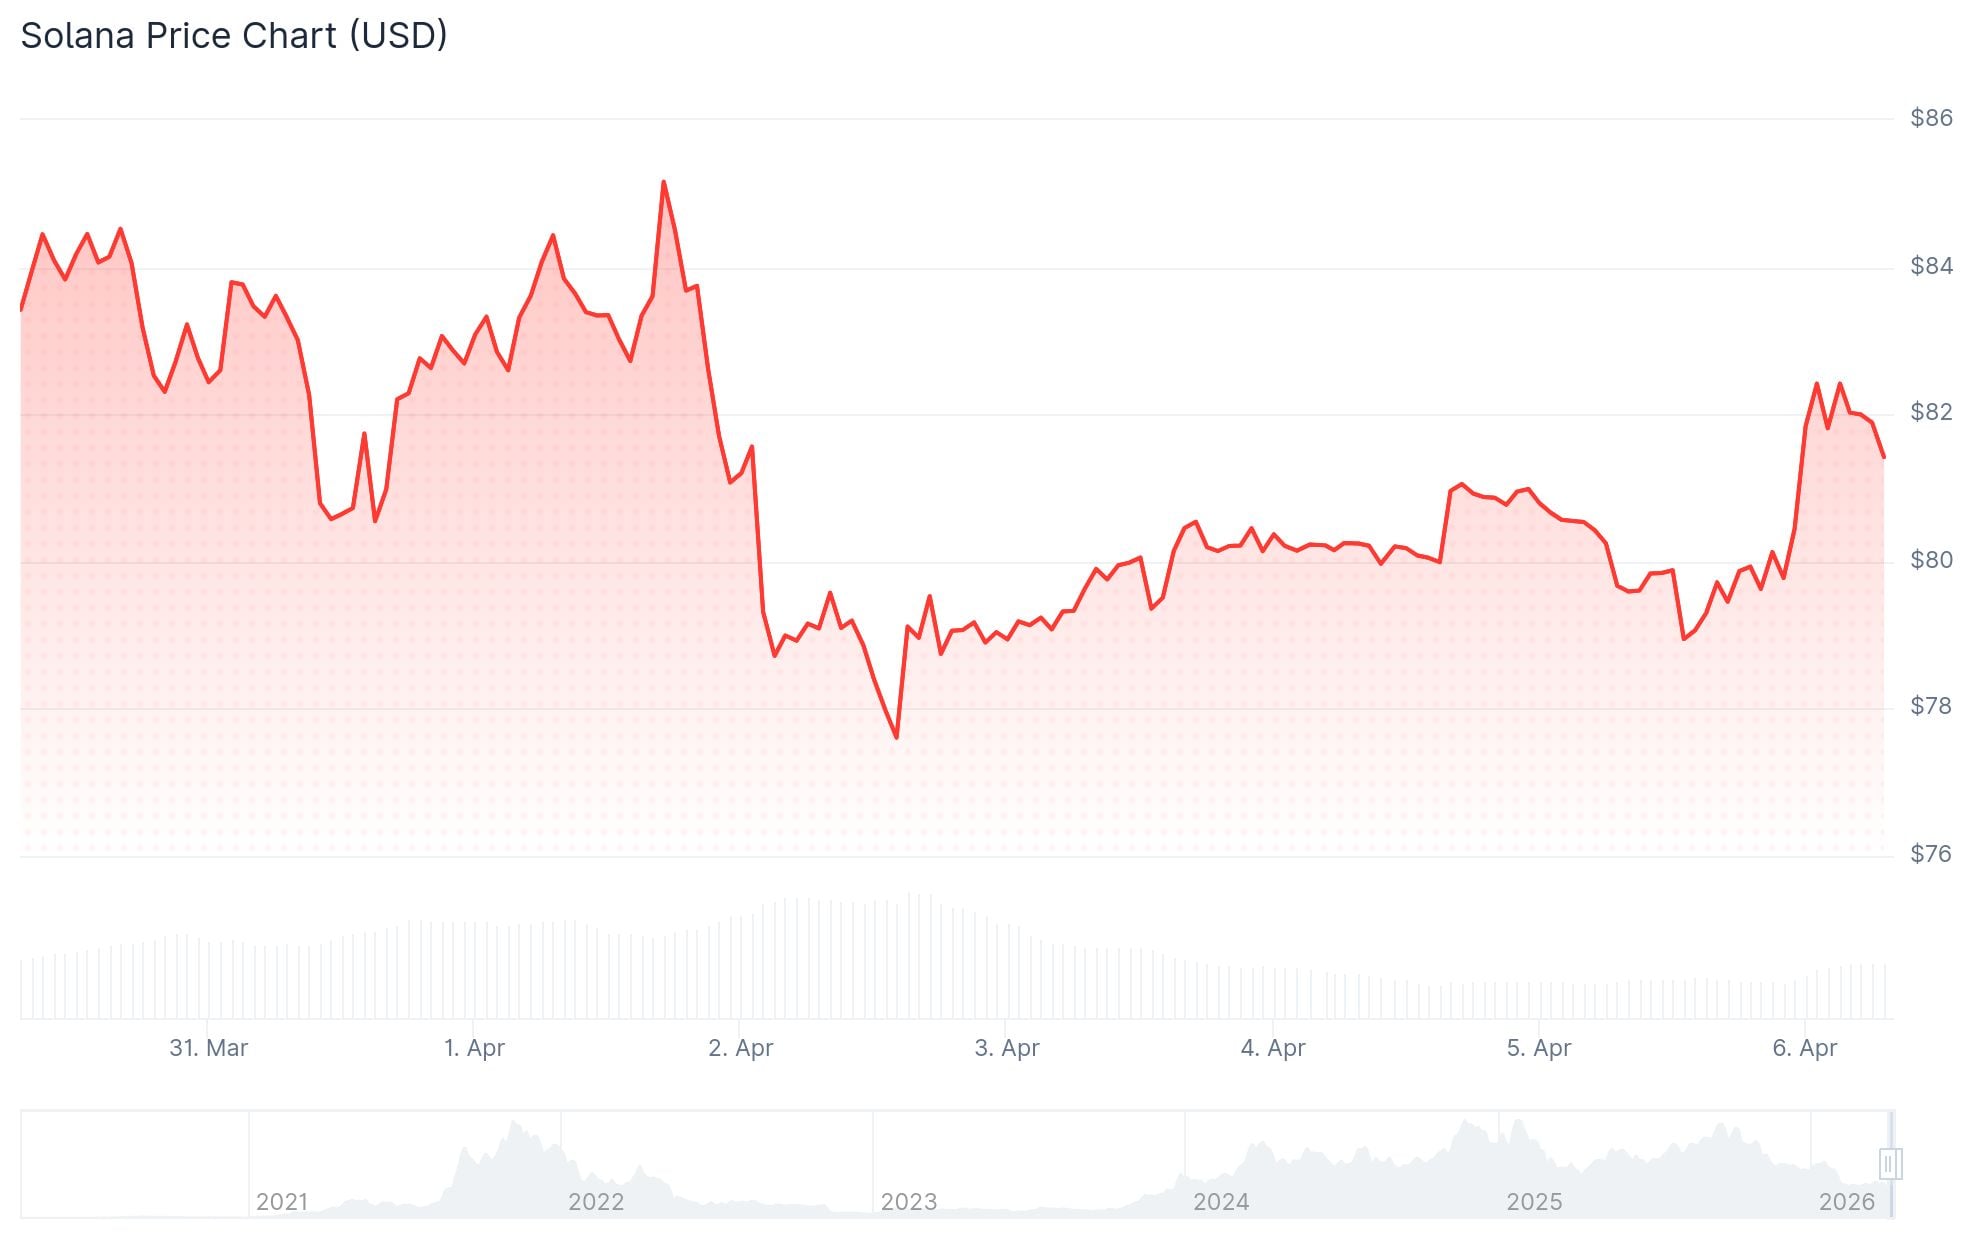 Solana (SOL) Price
The biggest driver of the sell-off is the $285 million exploit on Drift Protocol, a Solana-based DeFi platform, which occurred on April 1, 2026. North Korean hackers were linked to the attack. Drift’s total value locked (TVL) collapsed from $530 million to $230 million almost overnight.
That hack has shaken confidence across the broader Solana ecosystem. Investors are now reassessing the security of protocols built on the network.
TVL Decline Points to Capital Leaving Solana
DeFiLlama data shows Solana’s overall TVL has dropped from above $9 billion to roughly $5.5–$6 billion in recent weeks. That kind of decline reflects real capital leaving the network, not just price movement.
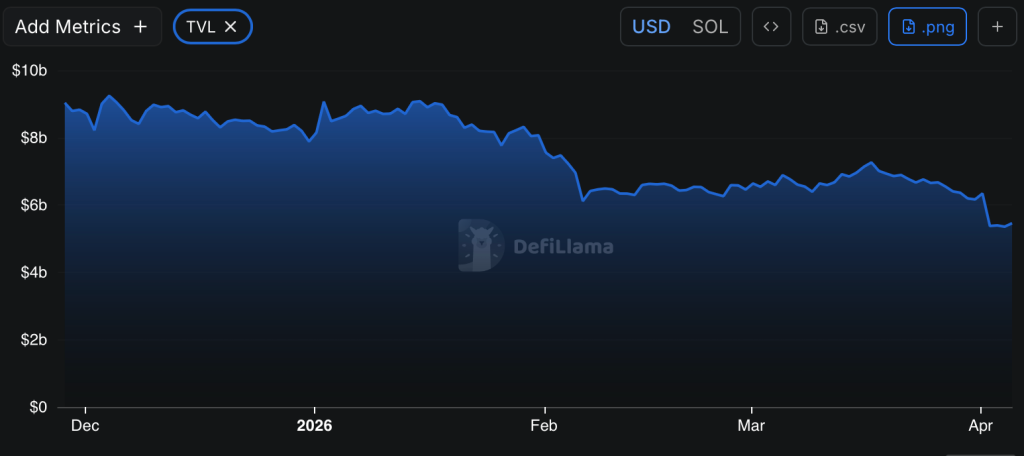 Source: DefiLlama
When TVL falls, it signals that fewer users are deploying funds into DeFi protocols. It also makes it harder for new capital to come in, since confidence is low.
On-chain data from Glassnode, shared by analyst Ali Charts, shows that 1.40 million SOL worth around $110 million moved to exchanges over a 72-hour window. Exchange balances climbed from 26.5 million SOL on March 31 to 28.6 million by April 2. Higher exchange balances can point to potential selling ahead, though it does not confirm it outright.
Technical Levels Traders Are Watching
Solana is currently testing a support zone between $75 and $78. The price has bounced from this area before, but repeated tests without a strong reaction weaken that support over time.
The RSI sits near 44, below the midline, and the MACD remains in negative territory. Both signals point to low momentum. The 50-day EMA sits at $88.80 and is the first resistance level SOL would need to clear for any meaningful recovery.
Analyst Crypto Patel shared a long-term chart showing SOL sitting near a Fibonacci support zone between $61.75 and $42.62. The chart points to a potential accumulation area if the current zone holds, referencing SOL’s previous 2,194% rally from 2022 lows. However, Crypto Patel noted that the $1,000-plus long-term target on the chart is a projection only, not a confirmed move.
SOL ETF data from Sosovalue shows a net weekly outflow of $5.24 million, marking the second consecutive week of outflows. Institutional demand remains weak in the near term.
The post Solana (SOL) Price: What the Charts and On-Chain Data Say About SOL in April appeared first on CoinCentral.


You May Also Like

Trump’s Vague Iran Ceasefire Stance Sparks Market Jitters

Will Altcoins Hit 100x in 2026?


