

Arbitrum (ARB) Price Prediction: Can Bulls Defend $0.35 Support to Spark a Q4 Recovery?

ARB has come under pressure in recent sessions, with its price hovering around $0.41 after failing to sustain above key short-term resistance zones. Once seen as Ethereum’s strongest scaling solution, ARB is now struggling with increased competition and notable outflows.
ARB Price Outlook
ARB is trading at $0.41 with a 24-hour drop of more than -2.5%. The daily chart highlights how volatile the token has been, spiking to $0.42 before falling back near $0.40. Market capitalization stands at roughly $2.23 billion, with trading volume around $187 million in the past day.
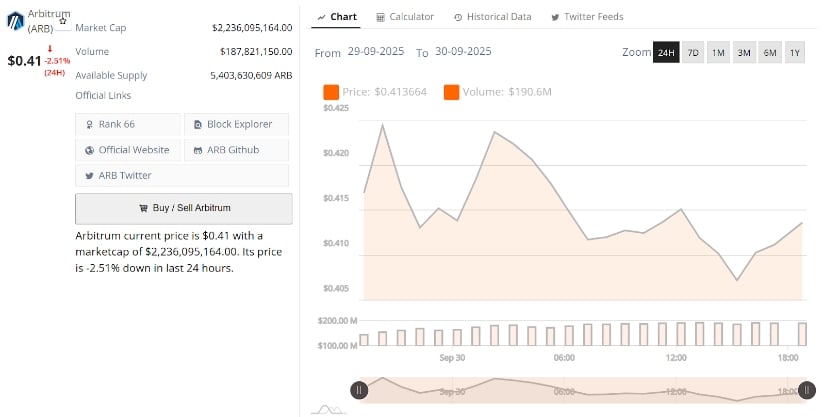
ARB’s current price is $0.41, down -2.51% in the last 24 hours. Source: Brave New Coin
The struggle to build clean higher lows is keeping sentiment fragile. If ARB can reclaim $0.45 in the coming sessions, momentum could tilt back toward buyers. But for now, the downside risks remain alive, with the chart leaning towards further tests of support levels.
Technical Patterns Show Key Zones Below
ARB has been playing out its chart patterns almost perfectly, yet remains largely overlooked. Analyst CRYPTOKNIGHT’s chart suggests that $0.35 to $0.30 stands as the major support zone to watch. Losing this range could invite deeper selling pressure and expose the lower accumulation zones.
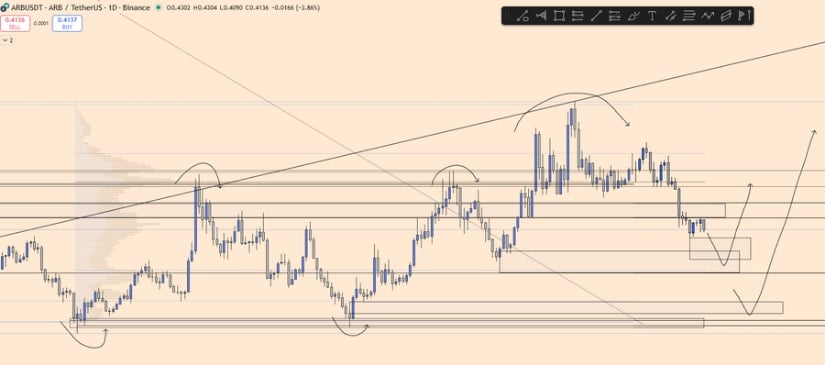
ARB hovers near key support at $0.35–$0.30 as technical patterns signal mounting downside risks. Source: CRYPTOKNIGHT via X
From a structural standpoint, ARB Arbitrum price is trading below trendline resistance and has failed to build strong bases above $0.45. Unless bulls regain control quickly, sellers will continue pressing the price towards these key downside levels.
Channel Breakdown Targets $0.35 Support
Another chart from Aman highlights how ARB recently broke down from a rising channel, confirming the weakening momentum. His analysis shows a retest of the $0.35 support zone as the most likely scenario before any significant rebound attempt.
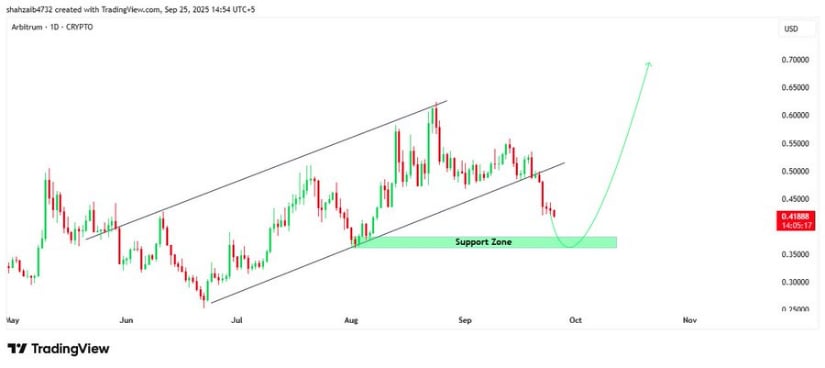
ARB breaks down from a rising channel, with $0.35 now emerging as the crucial support zone. Source: Aman via X
The setup suggests that as long as $0.35 holds, a recovery towards $0.50 to $0.55 is still possible in the mid-term. However, failure at this level risks accelerating losses toward $0.30. For participants, this makes the $0.35 zone the defining line between continuation and breakdown.
On-Chain Data Signals Bearish Outflows
Fresh on-chain data confirms a more cautious outlook for ARB Arbitrum. Over the past week, ARB topped the list of outflows, with more than $548 million leaving the network. In contrast, Ethereum saw inflows of over $11 billion, signaling a rotation of capital away from Arbitrum.
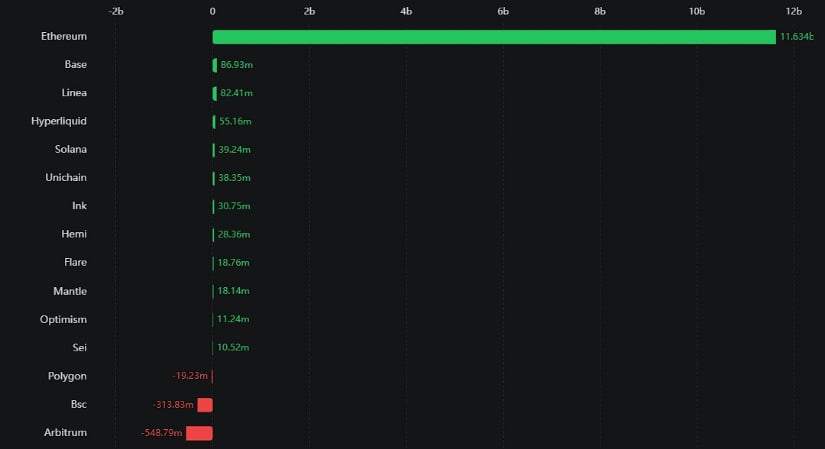
Arbitrum records over $548M in weekly outflows, signaling weaker confidence as capital rotates back into Ethereum. Source: Jesse Peralta via X
This bearish divergence highlights the challenges ARB faces in maintaining investor confidence. Outflows of this size often foreshadow weaker price action unless demand returns strongly. For now, participants must weigh the technical picture against these fundamental red flags.
Final Thoughts: Will ARB Recover in Q4 2025?
The next few weeks could be decisive for Arbitrum. Price action is circling near $0.41, but all eyes are on whether $0.35 holds firm as support. A strong defense here would give bulls the chance to flip momentum back in their favor and aim for a climb towards $0.50 to $0.55.
That kind of rebound could help ARB shake off recent bearish pressure and reestablish itself as a competitive player in Ethereum’s scaling space, keeping the ARB Price Prediction narrative alive for a potential recovery.
Still, caution dominates the broader picture. On-chain outflows of more than half a billion dollars show how capital has been rotating away from ARB, and repeated failures at resistance add to the uncertainty. If buyers fail to step up, the $0.30 zone may be tested before any real recovery attempt, leaving the ARB Price Prediction for Q4 2025 hanging on whether bulls can finally reclaim control.


추천 콘텐츠
Columnist has 'no sympathy' for the 'terrible' choice Republicans left themselves

History Shows Bitcoin ETF Outflows Favor Accumulation, Says Santiment

Alabama Enacts Dual Legislative Breakthrough in Blockchain and Judicial Reform


인기 뉴스
더보기
