

Bitcoin Price Pain Isn’t Over Yet As Selling Pressure Persists
Bitcoin price started a fresh decline below the $65,000 zone. BTC is showing bearish signs and might continue to move down if it dips below $62,000.
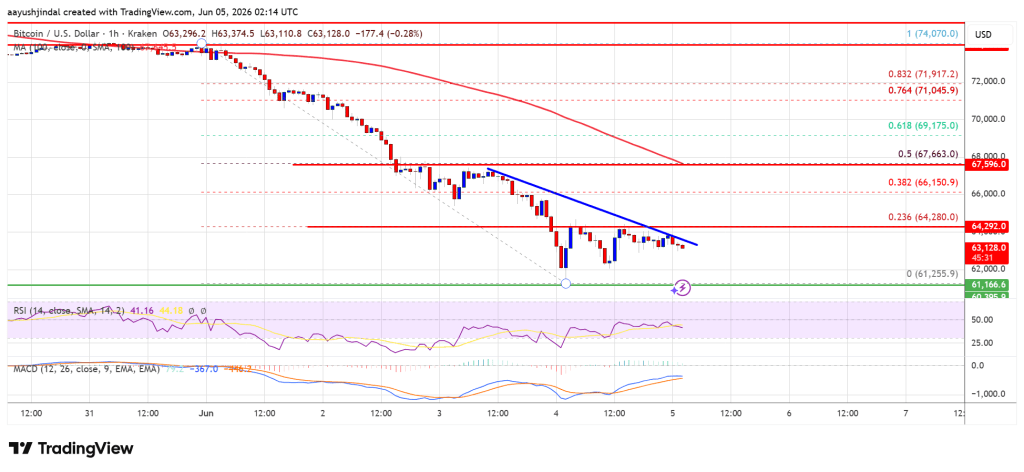
- Bitcoin failed to stay above $65,500 and extended losses.
- The price is trading below $64,000 and the 100 hourly simple moving average.
- There is a bearish trend line forming with resistance near $63,200 on the hourly chart of the BTC/USD pair (data feed from Kraken).
- The pair might extend losses if it stays below the $65,000 and $65,500 levels.
Bitcoin Price Extends Losses
Bitcoin price failed to stay above the $66,500 support zone. BTC remained in a bearish zone and extended losses below the $65,000 level. There was a move below the $64,000 level.
The price even dipped below $62,500. A low was formed at $61,255 and the price is still showing many bearish signs. It is below the 23.6% Fib retracement level of the downward move from the $74,070 swing high to the $61,255 low.
Bitcoin is now trading below $64,000 and the 100 hourly simple moving average. If the price remains stable above $61,200, it could attempt a fresh increase. Immediate resistance is near the $63,200 level. There is also a bearish trend line forming with resistance near $63,200 on the hourly chart of the BTC/USD pair.
The first key resistance is near the $64,000 level. A close above the $64,000 resistance might send the price further higher. In the stated case, the price could rise and test the $65,500 resistance.
Any more gains might send the price toward the $65,500 level. The next barrier for the bulls could be $67,650 or the 50% Fib retracement level of the downward move from the $74,070 swing high to the $61,255 low.
More Losses In BTC?
If Bitcoin fails to rise above the $64,000 resistance zone, it could start another decline. Immediate support is near the $62,000 level.
The first major support is near the $61,200 level. The next support is now near the $60,800 zone. Any more losses might send the price toward the $60,200 support in the near term. The main support now sits at $60,000, below which BTC might struggle to recover in the near term.
Technical indicators:
Hourly MACD – The MACD is now gaining pace in the bearish zone.
Hourly RSI (Relative Strength Index) – The RSI for BTC/USD is now below the 50 level.
Major Support Levels – $62,000, followed by $61,200.
Major Resistance Levels – $64,000 and $65,500.


추천 콘텐츠

Bloomberg: US House Committee May Release Crypto Tax Legislation Friday

CME CEO Terry Duffy warns crypto perpetual futures could threaten market stability

IronWorm Malware Targets Crypto Developers Through Supply Chains


인기 뉴스
더보기
