

Solana Price Falls Toward Key Support as ETF Outflows and Network Activity Weaken
Key Insights
- Solana price dropped toward a major support area as the broader crypto market weakened.
- Solana ETFs recorded net outflows after weeks of positive flows.
- DeFi activity, stablecoin supply, and futures open interest have declined from recent highs.
Solana price remained under pressure on June 4 as the broader cryptocurrency market extended its decline. SOL fell toward a key support zone after Bitcoin dropped below major resistance and risk appetite weakened across digital assets.
The decline also coincided with softer ETF demand, falling futures activity, and weaker on-chain metrics.
Solana Price Tracks Broader Crypto Market Weakness
The main reason behind the ongoing Solana price crash is that the broader crypto market is in a steep sell-off. Bitcoin dropped to nearly $60,000, while the market capitalization of all coins fell to $2.2 trillion.
This crypto crash has been triggered by the ongoing rotation from digital coins to the stock market, which continues to fire on all cylinders. The S&P 500 and Nasdaq 100 indices have all jumped by double digits this year, and their ETF inflows are on an uptrend.
This growth is happening because of the AI boom that has pushed top stocks to their record highs. For example, top stocks like Sandisk, Micron, Seagate, and Western Digital have all jumped to their record highs this year. This interest is leading to a lower demand for other assets like crypto and gold.
SOL ETFs Experienced Redemptions on Wednesday
Solana price is also slumping because of the performance of its ETFs. These funds have been highly resilient in the past few months, outperforming Bitcoin and Ethereum. They experienced the last outflow on April 30, when they lost $1.24 million in assets. In May, they experienced over $115 million in inflows as Bitcoin and Ethereum shed billions.
Therefore, SOL price is slumping today because the funds shed $12.7 million in assets on Monday. Bitwise’s BSOL shed over $11.56 million in assets, while Grayscale’s GSOL lost $1.15 million. That is a sign that investors are starting to capitulate.
Solana Experienced Substantial Selling
Meanwhile, data shows that liquidations in the crypto industry jumped to over $1.7 billion in the last 24 hours. Bitcoin’s liquidations jumped to $786 million, while Ethereum’s rose to $401 million. Solana positions worth over $90 million were liquidated in this period. Liquidations happen when exchanges are forced to close positions as losses mount. These liquidations often lead to more selling pressure.
The soaring liquidations coincided with the negative funding rate. A funding rate refers to a fee that bulls and bears pay in perpetual futures to maintain their positions. A negative funding rate is a sign that investors expect the future price to be lower than the spot price.
 Solana futures open interest | Source: TradingView
More data, as shown below, shows that Solana’s futures open interest has continued falling this month. It stood at $4.9 billion from a high of $16 billion in November last year.
Solana Fundamentals are Weakening
Third-party data shows that Solana’s fundamentals are weakening. Data shows that the total value locked in Solana’s DeFi ecosystem has continued falling this year. It retreated to $5.37 million, the lowest level since 2024. At its peak, the TVL stood at over $12 billion.
The same is happening with its stablecoin supply, which has slumped to $15 billion from a high of $16.5 billion in May. That is a sign that the situation is deteriorating, which is leading to lower fees.
SOL Price Technical Analysis
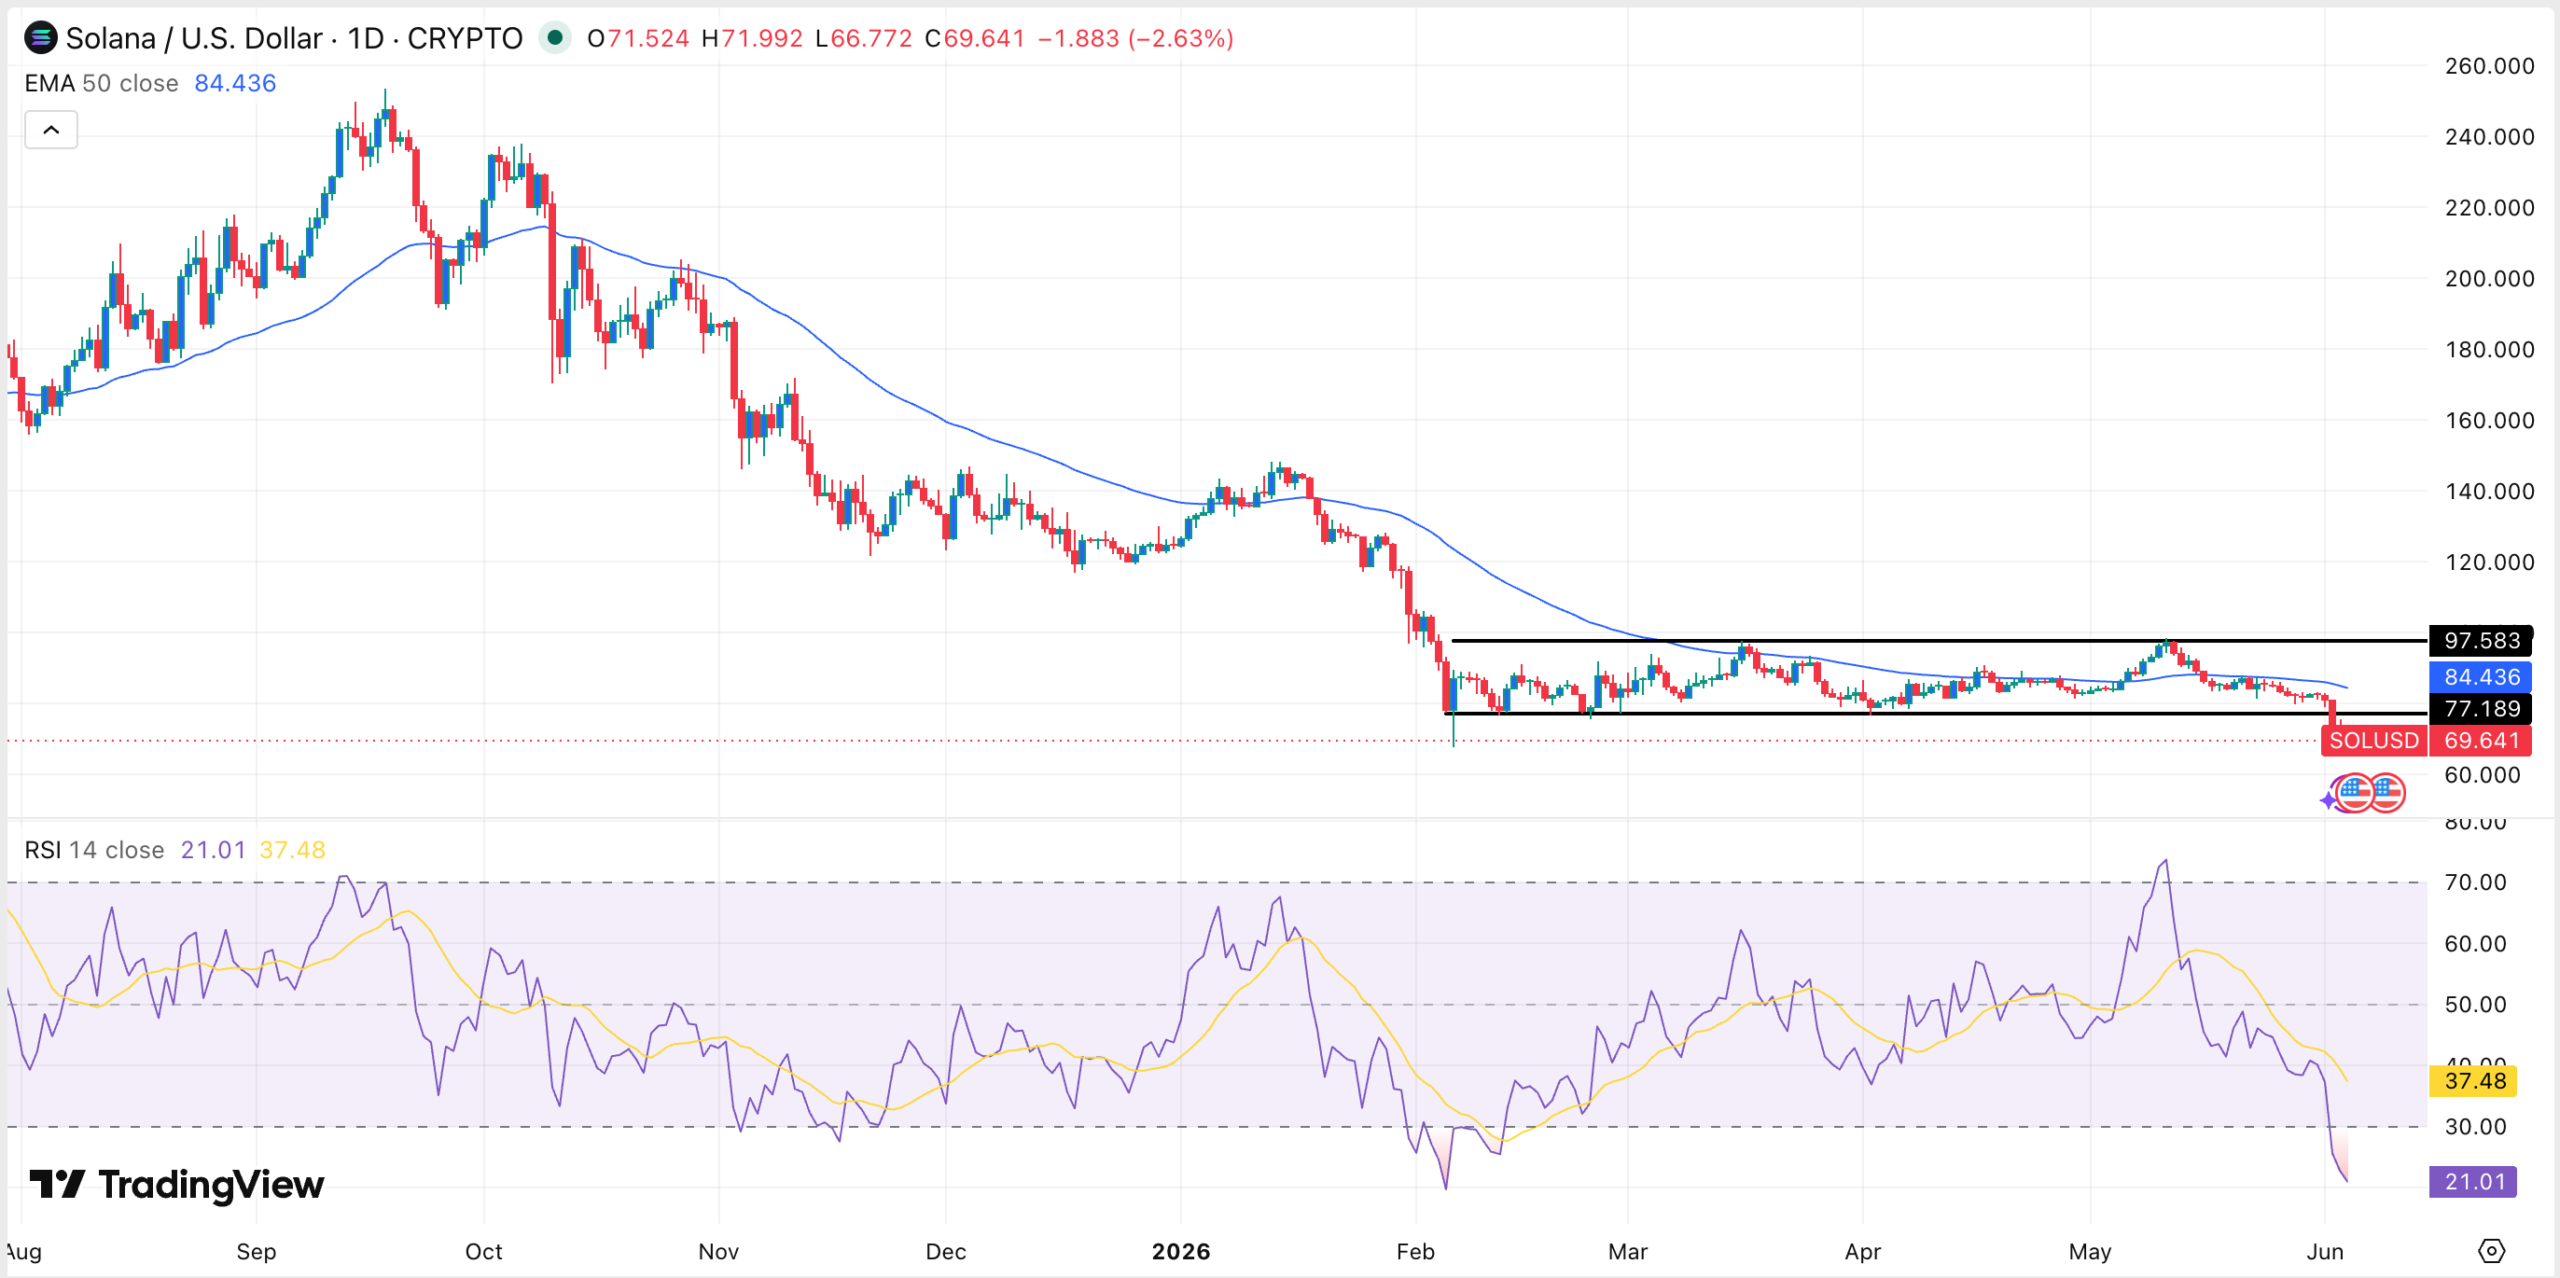 Solana price chart | Source: TradingView
The daily chart shows that the SOL price has slumped in the past few days, moving to its lowest level since February this year. It moved below the lower side of the horizontal channel, a sign that bears have prevailed.
The coin has slumped below all moving averages, a sign that bears have prevailed. There are also signs that the coin has formed a bearish flag pattern, a common bearish sign in technical analysis.
Therefore, the coin will likely have a strong bearish breakout in the near term. If this happens, the next key level to watch will be at $50.
The post Solana Price Falls Toward Key Support as ETF Outflows and Network Activity Weaken appeared first on The Market Periodical.


추천 콘텐츠

BoJ Signals Rate Hike: Why the Japanese Yen May Finally Find Support

Alleged Huione Money Laundering Boss Extradited to China
ChatGPT Predicts the XRP Price and Ethereum Price if Bitcoin Crashes to $50K


인기 뉴스
더보기
