

Solana (SOL) Risks Slipping Deeper Into The Red As Momentum Fades
Solana failed to settle above $84 and trimmed most gains. SOL price is now consolidating losses above $78 and might continue to move down.
- SOL price started a fresh decline below $82 and $81.20 against the US Dollar.
- The price is now trading below $81.20 and the 100-hourly simple moving average.
- There is a bearish trend line forming with resistance at $82.00 on the hourly chart of the SOL/USD pair (data source from Kraken).
- The price could start a recovery wave if the bulls defend $78.80 or $78.00.
Solana Price Dips From $84
Solana price failed to remain stable above $83.20 and started a fresh decline, like Bitcoin and Ethereum. SOL declined below the $82 and $81.50 levels.
The bears even pushed the price toward $80. A low was formed at $79.01, and the price is now consolidating losses. There was a break above the 38.2% Fib retracement level of the downward move from the $83.26 swing high to the $79.01 low.
Solana is now trading below $81.20 and the 100-hourly simple moving average. On the upside, immediate resistance is near the $81.10 level or the 50% Fib retracement level of the downward move from the $83.26 swing high to the $79.01 low.
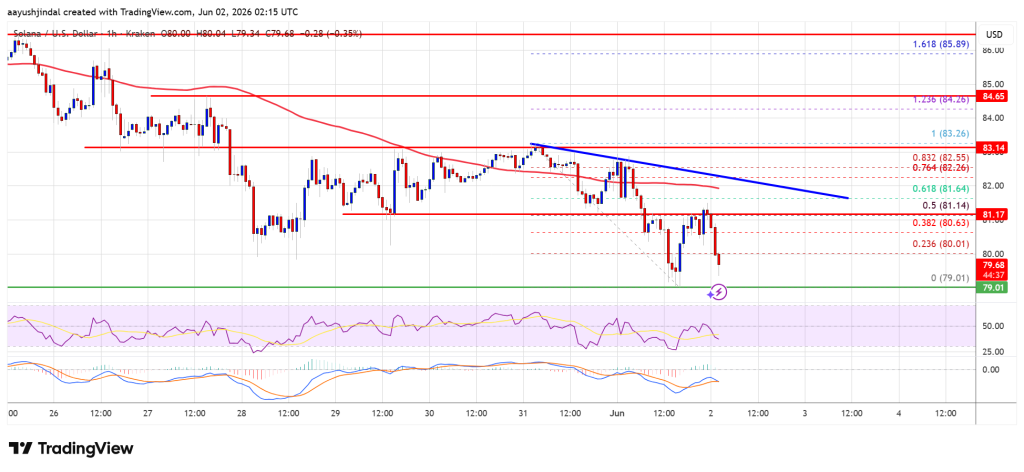
The next major resistance is near the $82.00 level. The main resistance could be $82.80. A successful close above the $82.80 resistance zone could set the pace for another steady increase. The next key resistance is $84.50. Any more gains might send the price toward the $85 level.
More Losses In SOL?
If SOL fails to rise above the $82.00 resistance, it could continue to move down. Initial support on the downside is near the $79 zone. The first major support is near the $78.00 level.
A break below the $78.00 level might send the price toward the $75 support zone. If there is a close below the $75 support, the price could decline toward the $70 support in the near term.
Technical Indicators
Hourly MACD – The MACD for SOL/USD is gaining pace in the bearish zone.
Hourly Hours RSI (Relative Strength Index) – The RSI for SOL/USD is below the 50 level.
Major Support Levels – $79.00 and $78.00.
Major Resistance Levels – $81.20 and $82.00.


추천 콘텐츠

Cryptopolitan Launches Crypto Data Dashboards and Becomes the First Media Platform with Full Agentic AI Access

Bitcoin Whales Are Quietly Accumulating: A Strategic Move That Could Signal Major Market Shift
Cardano Whales Accumulate Before August ETF as ADA Price Stays Low


인기 뉴스
더보기
