

SanDisk Stock Holds Bullish Breakout as Momentum Cools Near 1,600
SanDisk Stock (SNDK) extended its breakout to records and closed strong, but momentum cooled near 1,600 as new highs were digested. The bias stays bullish, with consolidation above support likely before the next push.
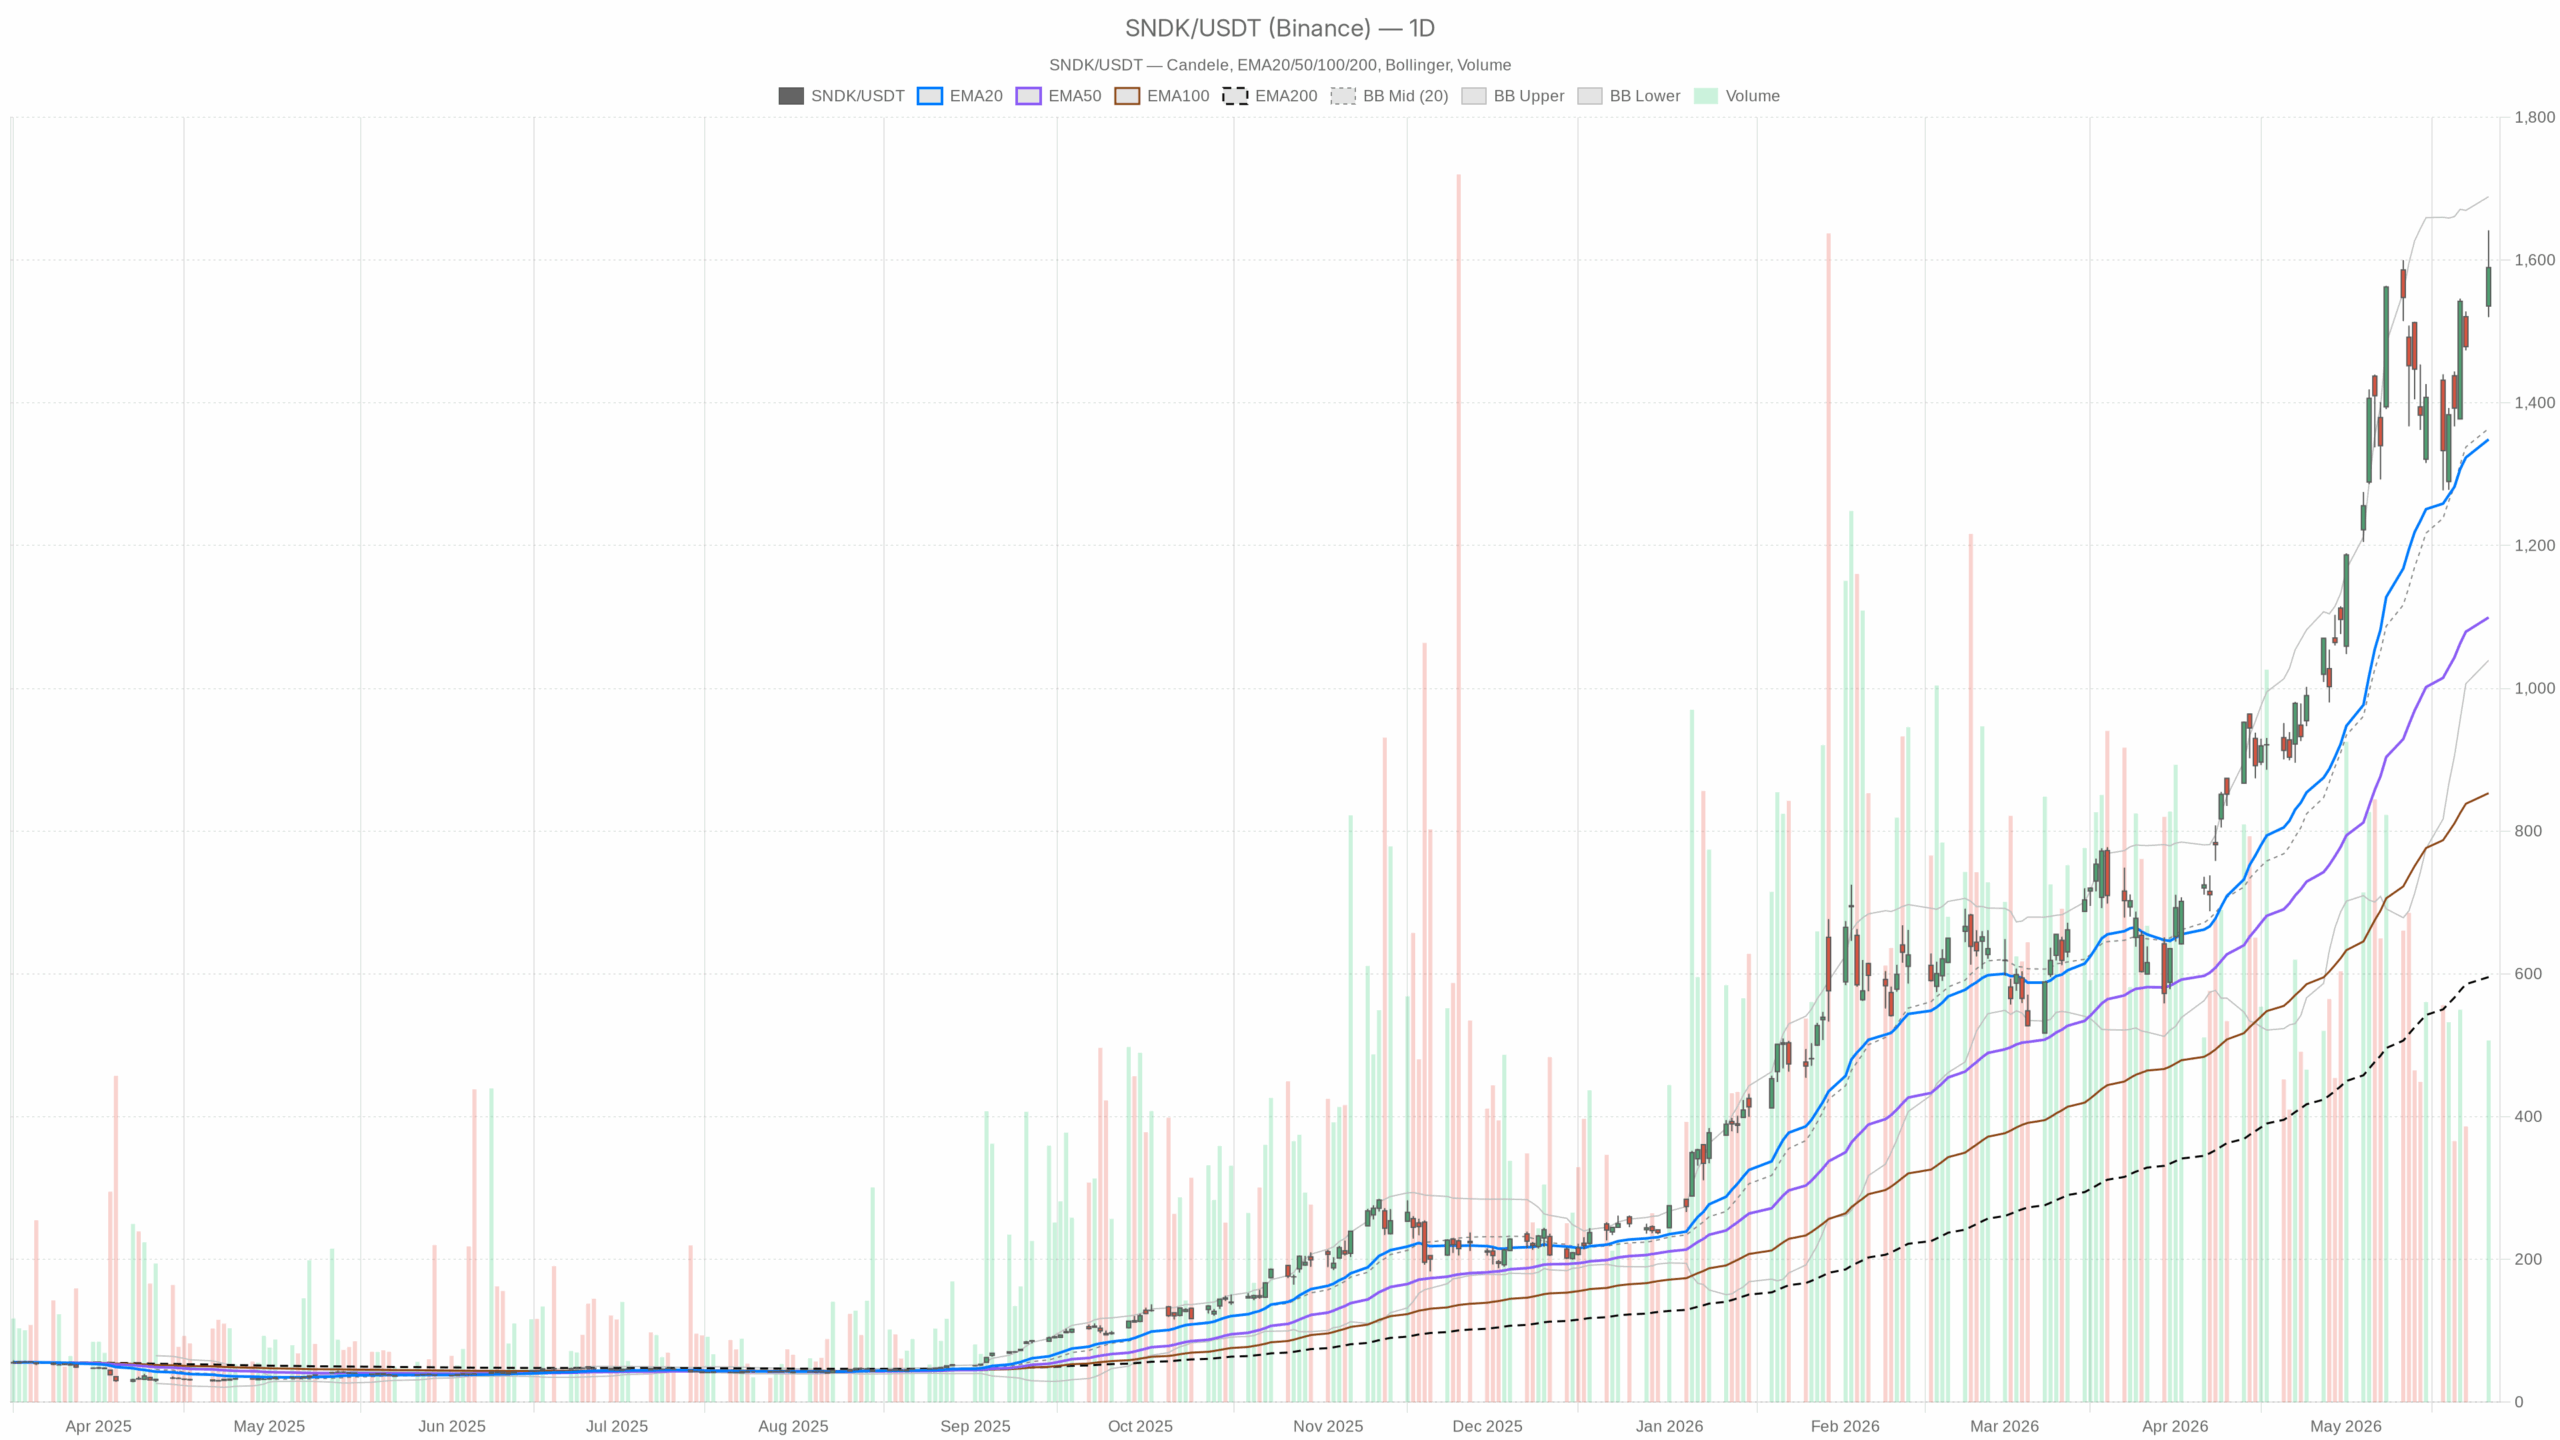 SNDK — daily chart with candlesticks, EMA20/EMA50 and volume.
SanDisk Stock technical outlook: trend intact as momentum cools near 1,600
Daily chart: mature uptrend, cooling momentum
On the daily timeframe, SanDisk Stock finished at 1,589.55, well above the rising 20-, 50-, and 200-day EMAs (EMA20 1,348.75; EMA50 1,099.34; EMA200 595.52). This reflects a mature uptrend with buyers defending pullbacks. Daily RSI14 sits at 68.34, implying strong upside pressure with mild overbought risk.
Meanwhile, the daily MACD histogram printed -3.95 while the line (141.3) slipped just under the signal (145.24). This shows cooling momentum even as the trend stays positive. Daily Bollinger Bands place price in the upper half, with a mid at 1,364.05 and an upper band near 1,688.90. Therefore, trend continuation is favored, but mean-reversion risk rises into the upper band. ATR14 is 126.83, keeping ranges wide. Daily pivot levels sit at PP 1,583.76, R1 1,647.53, S1 1,525.79.
Notably, 1,584 is a key pivot, 1,648 the upside gate, and 1,526 the first downside cushion.
Hourly chart: uptrend holds despite intraday fade
Meanwhile, the 1-hour chart corroborates the broader bullish bias despite an intraday fade. Price closed at 1,589.57 above the hourly EMA20 (1,539.30), EMA50 (1,474.32), and EMA200 (1,258.81). This keeps the short-term trend higher. Hourly RSI14 is 63.84, showing constructive momentum without immediate overbought stress.
The hourly MACD histogram is +4.24 with the line (47.92) above the signal (43.68), so upside momentum is still building intraday. The Bollinger mid is 1,542.59 with the upper band at 1,636.95, consistent with trend. Hourly ATR14 is 36.36, keeping swings meaningful.
At the same time, the hourly pivot is PP 1,597.57 with R1 1,609.14 and S1 1,578.01. The last print sits just below PP, a modest pullback within an uptrend, with 1,578 as first intraday support.
15-minute chart: neutral micro-structure after surge
At the execution layer, the 15-minute chart is neutral after the morning surge. Price is below the 15m EMA20 at 1,601.30 but above the EMA50 at 1,565.09, a shallow pullback within a larger uptrend. The 15m RSI14 is 48.85, keeping momentum flat near the midpoint.
The 15m MACD histogram is -4.47 with the line below the signal, so very near-term pressure favors consolidation or a dip. The 15m Bollinger mid is 1,605.36 with the lower band at 1,572.39, and price is leaning on the lower half, consistent with a pause.
Meanwhile, the 15m pivot sits at PP 1,593.48 with R1 1,600.95 and S1 1,582.11. Micro structure favors a retest of 1,582–1,593 before direction resolves.
SanDisk Stock news flow and catalysts
Notably, news flow aligns with the technical backdrop. SanDisk will be added to the Russell 1000 Growth Index per a preliminary FTSE Russell list. Index-related demand can cushion dips into the rebalancing window. Recent coverage also highlights an AI-driven shift with 78.4% gross margin, $5.95B revenue, 233% data center growth, and a $6B buyback. Therefore, the fundamental narrative supports sustained interest and liquidity for SNDK.
Bullish scenario: base above 1,600 keeps pressure on 1,641–1,648
Therefore, the main scenario is bullish. Holding above the 1,578–1,584 band (hourly S1 and daily PP) and reclaiming 1,600/1,609 (hourly PP/R1) would keep pressure on 1,641–1,648 (recent high/daily R1). For SanDisk Stock, a base above 1,600 would set up a potential run toward the daily upper band near 1,689 if momentum re-accelerates and the daily MACD histogram turns back positive.
Risk scenario: break of 1,578 weakens the SanDisk Stock bull case
On the other hand, the bullish case weakens if 1,578 breaks convincingly on a closing basis. That would open 1,526 (daily S1) and risk a deeper mean reversion toward the daily Bollinger mid at 1,364 if selling broadens. A further slide in the daily MACD and an RSI drift below 60 would mark a momentum regime shift, while sustained 15m closes below its EMA50 would signal that sellers control the tape intraday.
SanDisk Stock outlook: elevated volatility around 1,600
Overall, SNDK’s bias is up, but the market is digesting gains around the 1,600 handle. Elevated ATR across timeframes argues for two-way volatility and disciplined level awareness. Until momentum re-accelerates or support fails, expect range development with buyers defending 1,578–1,584 and sellers probing into 1,609–1,648.


추천 콘텐츠

Crypto exchanges with lowest fees

Streamex Appoints Former Microsoft and PayPal Designer Kori Handy as VP of Product and Design

Metaplanet Surges to Third Place in Global Bitcoin Holdings, Overtaking MARA Despite Stock Decline


인기 뉴스
더보기
