

XRP Price Sentiment Flips to Extreme FUD, Historically a Buy Signal
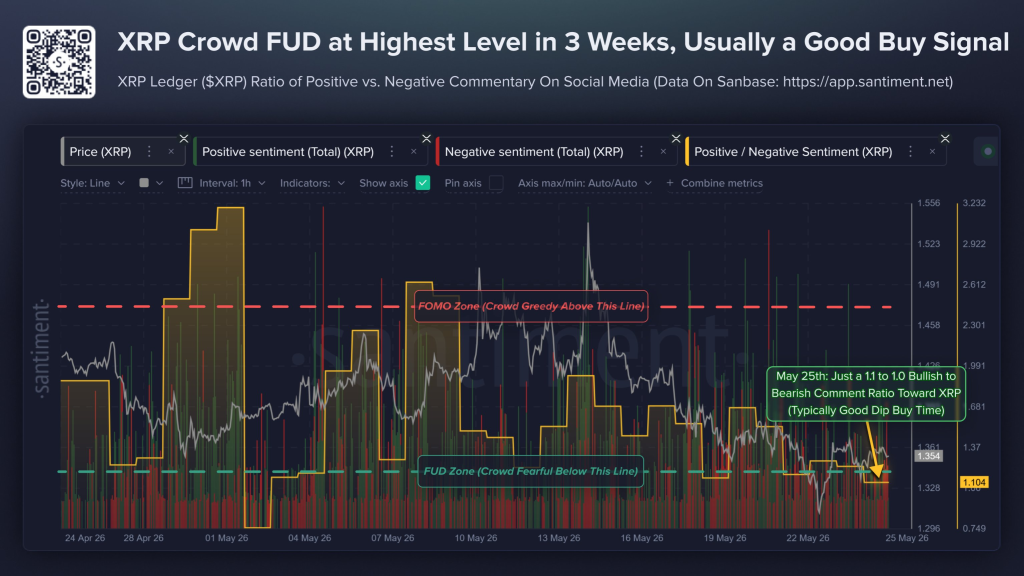
XRP price dipped 3% last week and now trades around $1.34 at press time. The decline brought out the bears on social media. Santiment reported that the ratio of positive to negative commentary on XRP dropped to just 1.1 bullish comments for every 1 bearish comment. That is the most fearful crowd sentiment in three weeks.
Historically, such extreme FUD has often acted as a contrarian buy signal. Let’s analyze the sentiment chart and then look at XRP’s technicals.
Santiment: FUD Zone Flashes – A Historical Dip-Buy Signal
Santiment’s chart (attached) tracks the ratio of positive vs. negative social media comments about the XRP price. The upper zone is marked “FOMO Zone” (crowd greedy), and the lower zone is “FUD Zone” (crowd fearful). On May 25, the ratio fell to approximately 1.1, just above the FUD threshold. That is the lowest reading since early May.
The chart shows previous dips into the FUD zone (around April 24-28, May 1, and May 13) all of which were followed by price stabilization or short-term bounces. Conversely, when the ratio climbed into the FOMO zone above 1.5, XRP often topped shortly after.
 Source: X/@SantimentData
Santiment explains that when traders become overly fearful, weak hands have already sold, reducing selling pressure. When they become overly greedy, too many buyers are already positioned, leaving no fuel for further upside.
The current reading of 1.1 is not as extreme as the 0.75 seen on May 1, but it is the lowest in three weeks. This means that social media sentiment is turning bearish, which historically has been a good time to accumulate rather than panic sell.
XRP Price Analysis – Key Levels and Indicators
We also looked at our daily XRP price prediction and current indicator readings.
Current price: $1.34, down 3%.
Price structure remains range-bound between $1.30 support and $1.42 resistance.
XRP Price: Key levels to watch
Support:
$1.30 (psychological), $1.333 (recent low)
Resistance:
$1.374 (minor), $1.42 (major)
RSI (14): 45.555 – neutral territory, leaning slightly bearish but not oversold. No extreme readings.
STOCH (9,6): 48.592 – also neutral, confirming range-bound movement without aggressive buying or selling pressure.
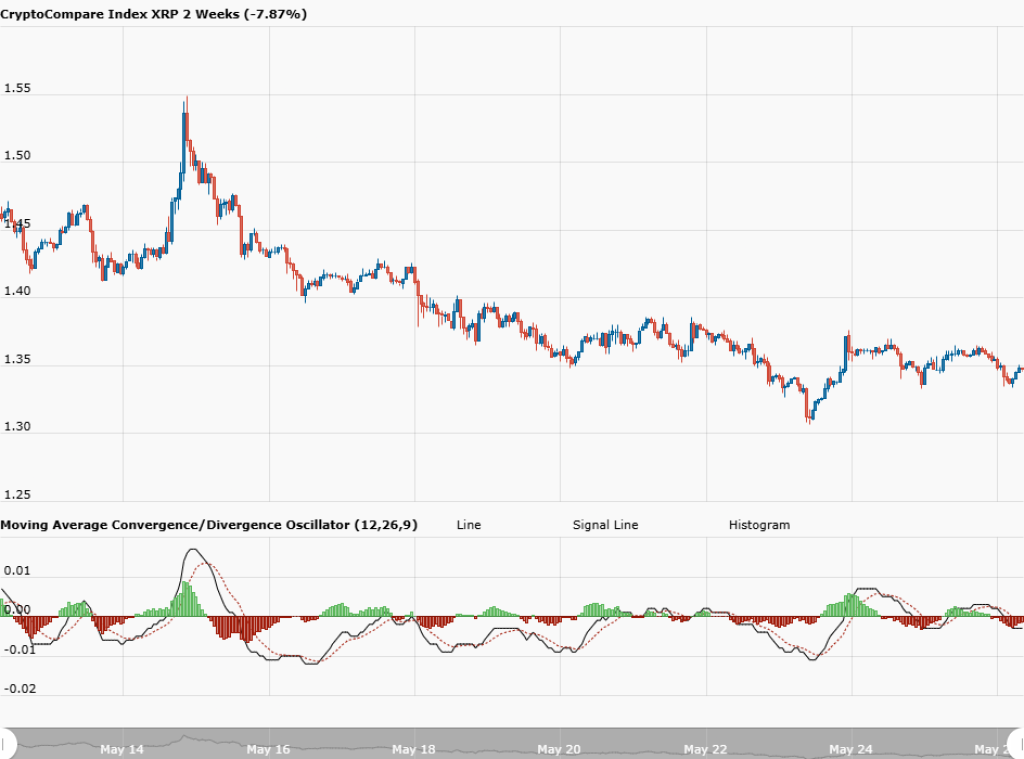
MACD analysis (from the provided crypto-compare chart): The second chart shows MACD lines (12,26,9) from May 14 to May 26. The MACD line (blue) and signal line (orange) have been converging near zero.
 Source: CryptoCompare.com
The histogram is small and positive, but barely. This indicates that bullish momentum is very weak. The MACD lines have not crossed decisively. Essentially, the market is in a holding pattern with no clear directional momentum.
Volume: The chart shows low, consistent volume. No spikes on down days, which suggests selling is not panicked. But also no buying volume to push price higher.
Read more XRP news: XRP Price Prediction if the CLARITY Act Gets Delayed to 2027
XRP Price Outlook
The sentiment signal is a positive long-term indicator: FUD zones have historically led to rebounds. However, the technical indicators show a market that is still undecided. RSI at 45, MACD flat, price below all major moving averages (not shown but implied from earlier analysis). The 200-day MA is far above at $1.69.
For a rebound to materialize, XRP needs to hold $1.30 support and reclaim $1.35. A break above $1.374 would open the door to $1.42. A break below $1.30 would send price to $1.26 or even $1.20.
The contrarian case is compelling: crowd sentiment is fearful, weak hands are gone. But the market needs a catalyst – Clarity Act progress, ETF inflows, or a Bitcoin bounce – to turn sentiment into actual buying.
In the short term, expect continued range trading between $1.30 and $1.40. For long-term believers, the FUD zone is a reasonable accumulation area.
XRP’s crowd sentiment ratio dropped to 1.1 – the most fearful in three weeks. Santiment’s historical data shows that such FUD zones often precede price bounces.
Technicals show a neutral market (RSI 45.5, MACD flat) with key support at $1.30 and resistance at $1.42. A rebound is possible, but it needs a catalyst. The contrarian signal is flashing. Watch $1.30 support.
FAQs

A level on Santiment’s sentiment chart where negative comments significantly outweigh positive ones. Historically, XRP has bounced after entering this zone.
Yes, historically XRP has seen sharp rallies after regulatory clarity (e.g., 2017, 2021). The current catalyst is the CLARITY Act; if it passes the Senate, institutions could drive price toward $2-$4. Without it, XRP may stay range-bound for months.
Almost certainly not. Even the most bullish institutional forecasts (Standard Chartered, Bitwise) have XRP in the $3-$30 range by 2030. $100 would require a market cap of over $5 trillion – larger than Ethereum and Bitcoin combined – which is unrealistic.
If you have a long-term horizon (2-5 years), holding through the current FUD makes sense because the CLARITY Act and ETF inflows could drive a multiple. If you need cash or can’t tolerate a drop below $1.30, selling some at resistance ($1.42-$1.50) is reasonable. To be clear – this is not financial advice.
Subscribe to our YouTube channel for daily crypto updates, market insights, and expert analysis.
The post XRP Price Sentiment Flips to Extreme FUD, Historically a Buy Signal appeared first on CaptainAltcoin.


추천 콘텐츠

Qualcomm (QCOM) Stock Hits All-Time High After ByteDance AI Chip Deal

Alaska’s Largest City Selects Tyler Technologies to Modernize Resident Payment Experience

Pragmatic Play Slots at Crypto Casinos: Best Titles & Max Wins



