

Gold Price Crash Explained – Here’s the Hidden Reason Most Analysts Missed
Gold price usually performs well during periods of geopolitical fear and rising inflation. That relationship has existed for decades, which made the recent decline in XAUUSD even more surprising. Oil prices jumped after fresh concerns around the Strait of Hormuz created fears about energy supply disruptions. Inflation concerns returned almost immediately. Many market participants expected gold price to rally strongly under those conditions.
The opposite happened instead. Gold price moved lower even as energy costs climbed and uncertainty spread across global markets. That unusual reaction pushed analysts to search for explanations beyond the usual safe-haven narrative.
Dollar Demand During the Energy Crisis Put Heavy Pressure on Gold Price
A market explanation shared on X by @ThePenguinBTC presented a very different perspective on the gold price crash. The argument focused less on weakness in gold itself and more on how global energy markets still depend heavily on the US dollar.
The explanation started with the Strait of Hormuz situation. Roughly one-fifth of global seaborne oil passes through that route. Energy markets reacted quickly once fears about disruptions increased. Oil prices climbed sharply, and countries importing energy suddenly needed more dollars to secure supply.
That reaction created a major problem for gold price. Oil transactions continue to rely mostly on USD payments worldwide. Countries dealing with rising energy bills had to secure larger dollar reserves quickly. Demand for the dollar increased at the same moment many investors expected gold to benefit from inflation fears.
The analysis explained that the stronger dollar created downward pressure on XAUUSD. Gold price often struggles whenever USD strength accelerates because gold is priced globally in dollars.
Another issue came from changing expectations around Federal Reserve rate cuts. Gold had received support for months from expectations that interest rates would move lower later this year. Rising energy prices complicated that outlook because higher inflation reduces the likelihood of rapid rate cuts.
Gold also faced pressure from leveraged portfolio funds. Large investment firms often hold positions across multiple assets using borrowed capital. Losses in other markets forced some funds to raise cash quickly. Gold became one of the easiest profitable assets to liquidate.
The explanation pointed toward another important factor. Energy importing countries reportedly needed more dollars to handle rising oil costs. Governments facing liquidity pressure could have sold portions of their gold reserves to raise USD liquidity.
That idea changes the entire narrative around the gold price decline.
Gold was not necessarily sold because confidence disappeared. Gold price weakened because the global system still depends heavily on the dollar during energy crises.
Related Article: Gold Price Prediction: Target $15,000 by 2034? Quarterly Candle Turned Bearish, But the Bull Market Isn’t Over
XAUUSD Chart Analysis Shows Gold Price Could Move Lower
A look at the XAUUSD chart shows gold price trading inside a descending channel after reaching highs close to $5,600 earlier this cycle. Since reaching that peak, gold price has dropped close to 20%.
Current price action still looks technically weak.
Gold price now trades close to the upper boundary of the descending channel. That area usually acts as resistance during bearish corrective structures. Sellers often defend those zones unless buyers push through with strong momentum.
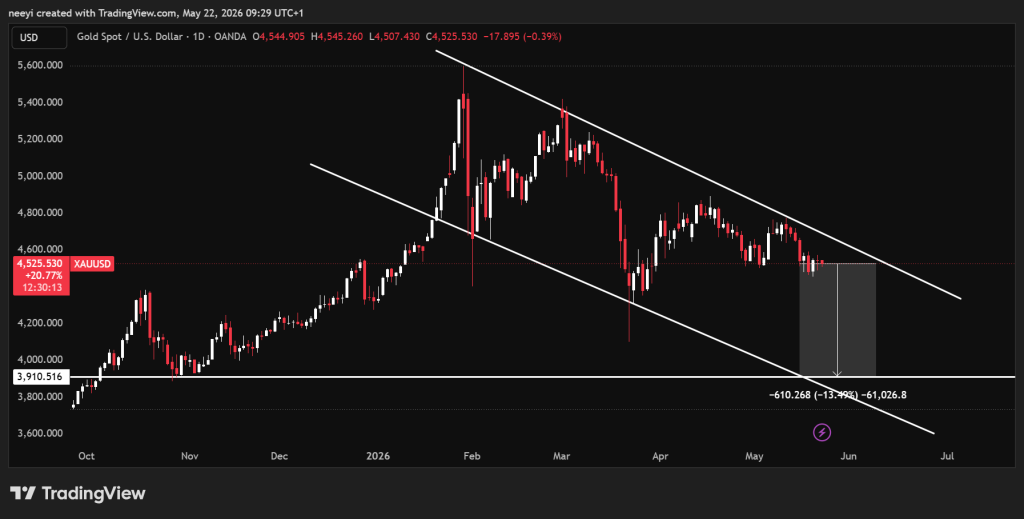
If this descending channel structure continues, gold price could move toward the lower boundary near $3,600 over the next phase of the correction.
Technical structures like descending channels often continue until resistance breaks decisively. A strong breakout above the top of the channel would change the current bearish outlook and force a reassessment of the trend.
Gold price now sits at a very important point technically and fundamentally. Rising energy costs, strong dollar demand, and uncertainty around Federal Reserve policy continue shaping the next move for XAUUSD.
Subscribe to our YouTube channel for daily crypto updates, market insights, and expert analysis.
The post Gold Price Crash Explained – Here’s the Hidden Reason Most Analysts Missed appeared first on CaptainAltcoin.


추천 콘텐츠

Trump Media Linked Wallet Moves $205M in Bitcoin to Raising Marke

StakeStone (STO) Rockets 125%: What $981M Trading Volume Reveals

Dogecoin and Hyperliquid Are Heating Up — But This New Project Might Be the One to Watch


인기 뉴스
더보기
