

Solana (SOL) Rebound Faces Major Test Near Key Resistance Zone
Solana found support at $83.50 and corrected some losses. SOL price is now consolidating below $88.50 and might struggle to continue higher.
- SOL price started a decent recovery wave above $85 and $86 against the US Dollar.
- The price is now trading above $86 and the 100-hourly simple moving average.
- There is a rising channel forming with resistance at $88.50 on the hourly chart of the SOL/USD pair (data source from Kraken).
- The price could continue to move up if it clears $88.50 and $90.00.
Solana Price Starts Recovery
Solana price remained stable and started a decent recovery wave from $83.50, like Bitcoin and Ethereum. SOL was able to climb above the $85 level.
There was a move above the 38.2% Fib retracement level of the downward move from the $93.63 swing high to the $83.35 low. However, the bears remained active below $88. There is also a rising channel forming with resistance at $88.50 on the hourly chart of the SOL/USD pair.
Solana is now trading above $86 and the 100-hourly simple moving average. On the upside, immediate resistance is near the $88.00 level. The next major resistance is near the $88.50 level or the 50% Fib retracement level of the downward move from the $93.63 swing high to the $83.35 low.
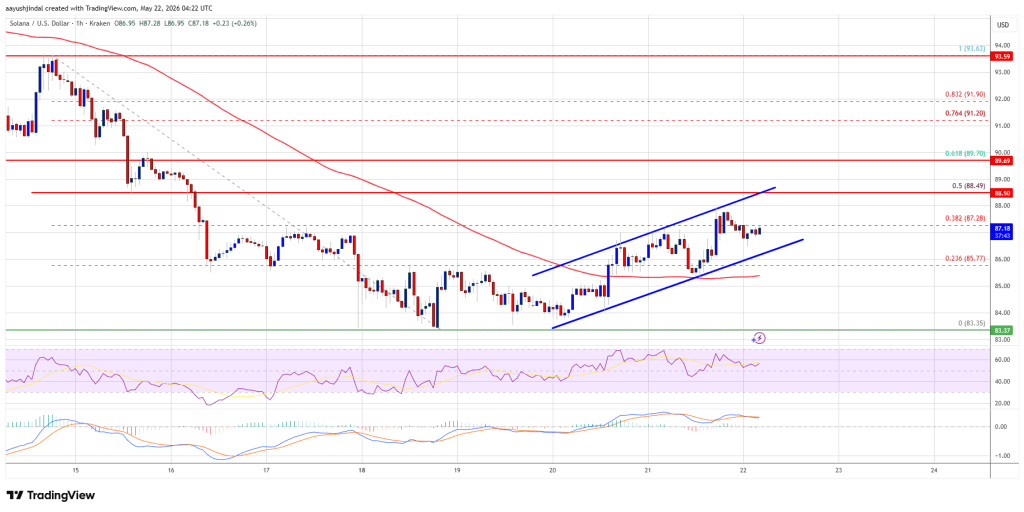
The main resistance could be $90. A successful close above the $90 resistance zone could set the pace for another steady increase. The next key resistance is $92. Any more gains might send the price toward the $94 level.
Another Decline In SOL?
If SOL fails to rise above the $88.50 resistance, it could continue to move down. Initial support on the downside is near the $86.20 zone. The first major support is near the $85.00 level.
A break below the $85.00 level might send the price toward the $83.50 support zone. If there is a close below the $83.50 support, the price could decline toward the $80 zone in the near term.
Technical Indicators
Hourly MACD – The MACD for SOL/USD is losing pace in the bearish zone.
Hourly Hours RSI (Relative Strength Index) – The RSI for SOL/USD is above the 50 level.
Major Support Levels – $86.200 and $85.00.
Major Resistance Levels – $88.50 and $90.00.


추천 콘텐츠

Trump reveals Pam Bondi will have no role in his administration after her firing

From Telegram to Terminal: Banana Gun’s Pro Platform Hits Ethereum as User Base Surpasses One Million
Bitcoin Whales Dump $1.42B in Four Days Amid Short Squeeze Setup Near $78K


인기 뉴스
더보기
