Ethereum whales hit 2021-level profits as outflows surge and staking slows. The asset eyes breakout above all-time high.Ethereum whales hit 2021-level profits as outflows surge and staking slows. The asset eyes breakout above all-time high.

ETH Whales’ Profits Hit Records: Massive Rally or Big Price Drop Next?

2025/09/19 12:06
3 min di lettura
Per feedback o dubbi su questo contenuto, contattateci all'indirizzo [email protected].

TL;DR

  • Whale wallets now show unrealized profits equal to 2021 levels, signaling strong market confidence.
  • ETH outflows from exchanges spike as holders move coins to cold storage or staking platforms.
  • September staking inflows drop to 8.4K ETH, cooling sharply after August’s record-high deposits.

Whale Profit Levels Return to 2021 Highs

Ethereum wallets holding between 10,000 and 100,000 ETH have now reached the same unrealized profit levels seen during the 2021 market peak. This data suggests large holders are once again sitting on sizable paper gains.

In 2017, whale wallets saw unrealized profits peak at around $15 billion. By 2021, this figure had grown to more than $45 billion. As of September 2025, that level has been matched. Charts tracking whale wallet performance show a clear return to the high-profit zone last seen before ETH’s strongest rallies.

Crypto analyst commented,

Though similar conditions led to large price increases in the past, it is not guaranteed that the same will happen again.

Exchange Flows Point to Lower Selling Pressure

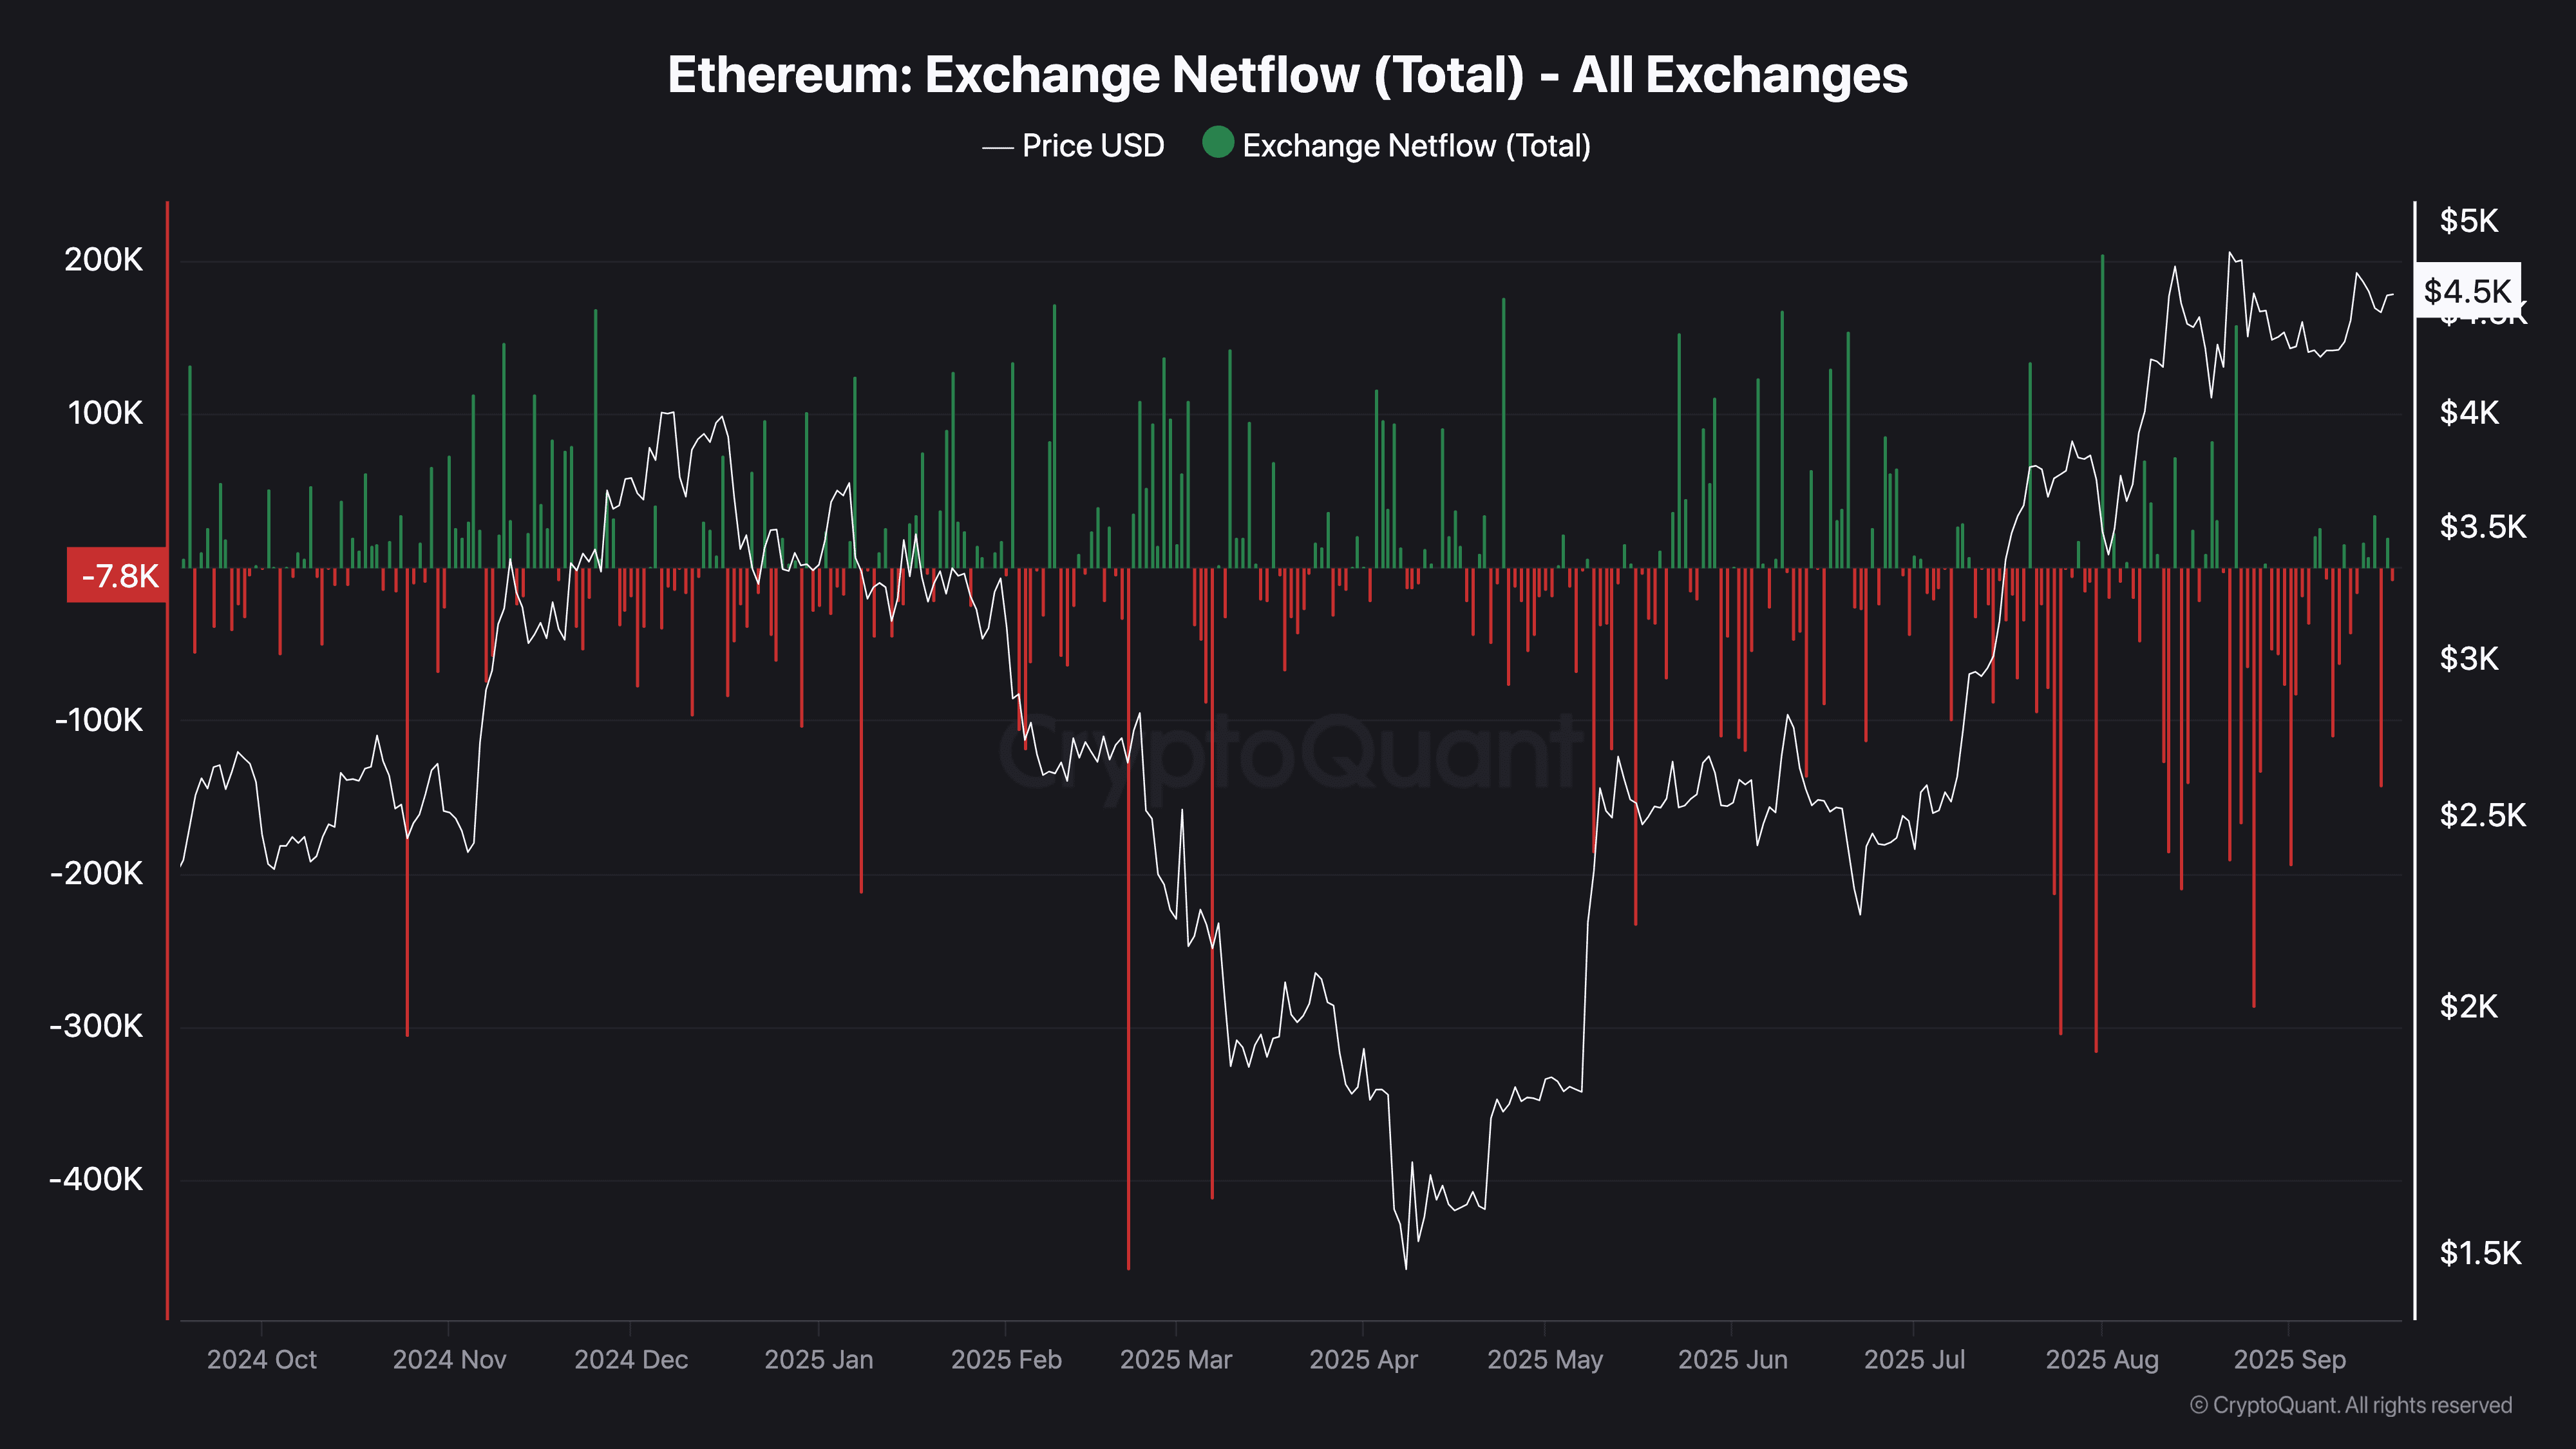
During early 2025, Ethereum saw large volumes of ETH moved onto exchanges. In February and March, inflows above 200,000 ETH occurred as the price fell from over $3,000 to around $1,500. This activity typically signals selling.

Notably, that trend reversed by mid-2025. From June onwards, more ETH began leaving exchanges than entering. Outflow spikes ranged from 200,000 to 400,000 ETH. This behavior change came as ETH started recovering and climbing past $4,000. Large outflows are often linked to reduced sell-side activity as coins are moved off exchanges.

Ethereum Exchange Netflow (Total) - All ExchangesSource: CryptoQuant

By August and September, this pattern continued while ETH traded near $4,500. Withdrawals remained high, suggesting that holders were choosing to secure their ETH off platforms, possibly for long-term storage or staking.

Staking Inflows Rise, Then Drop in September

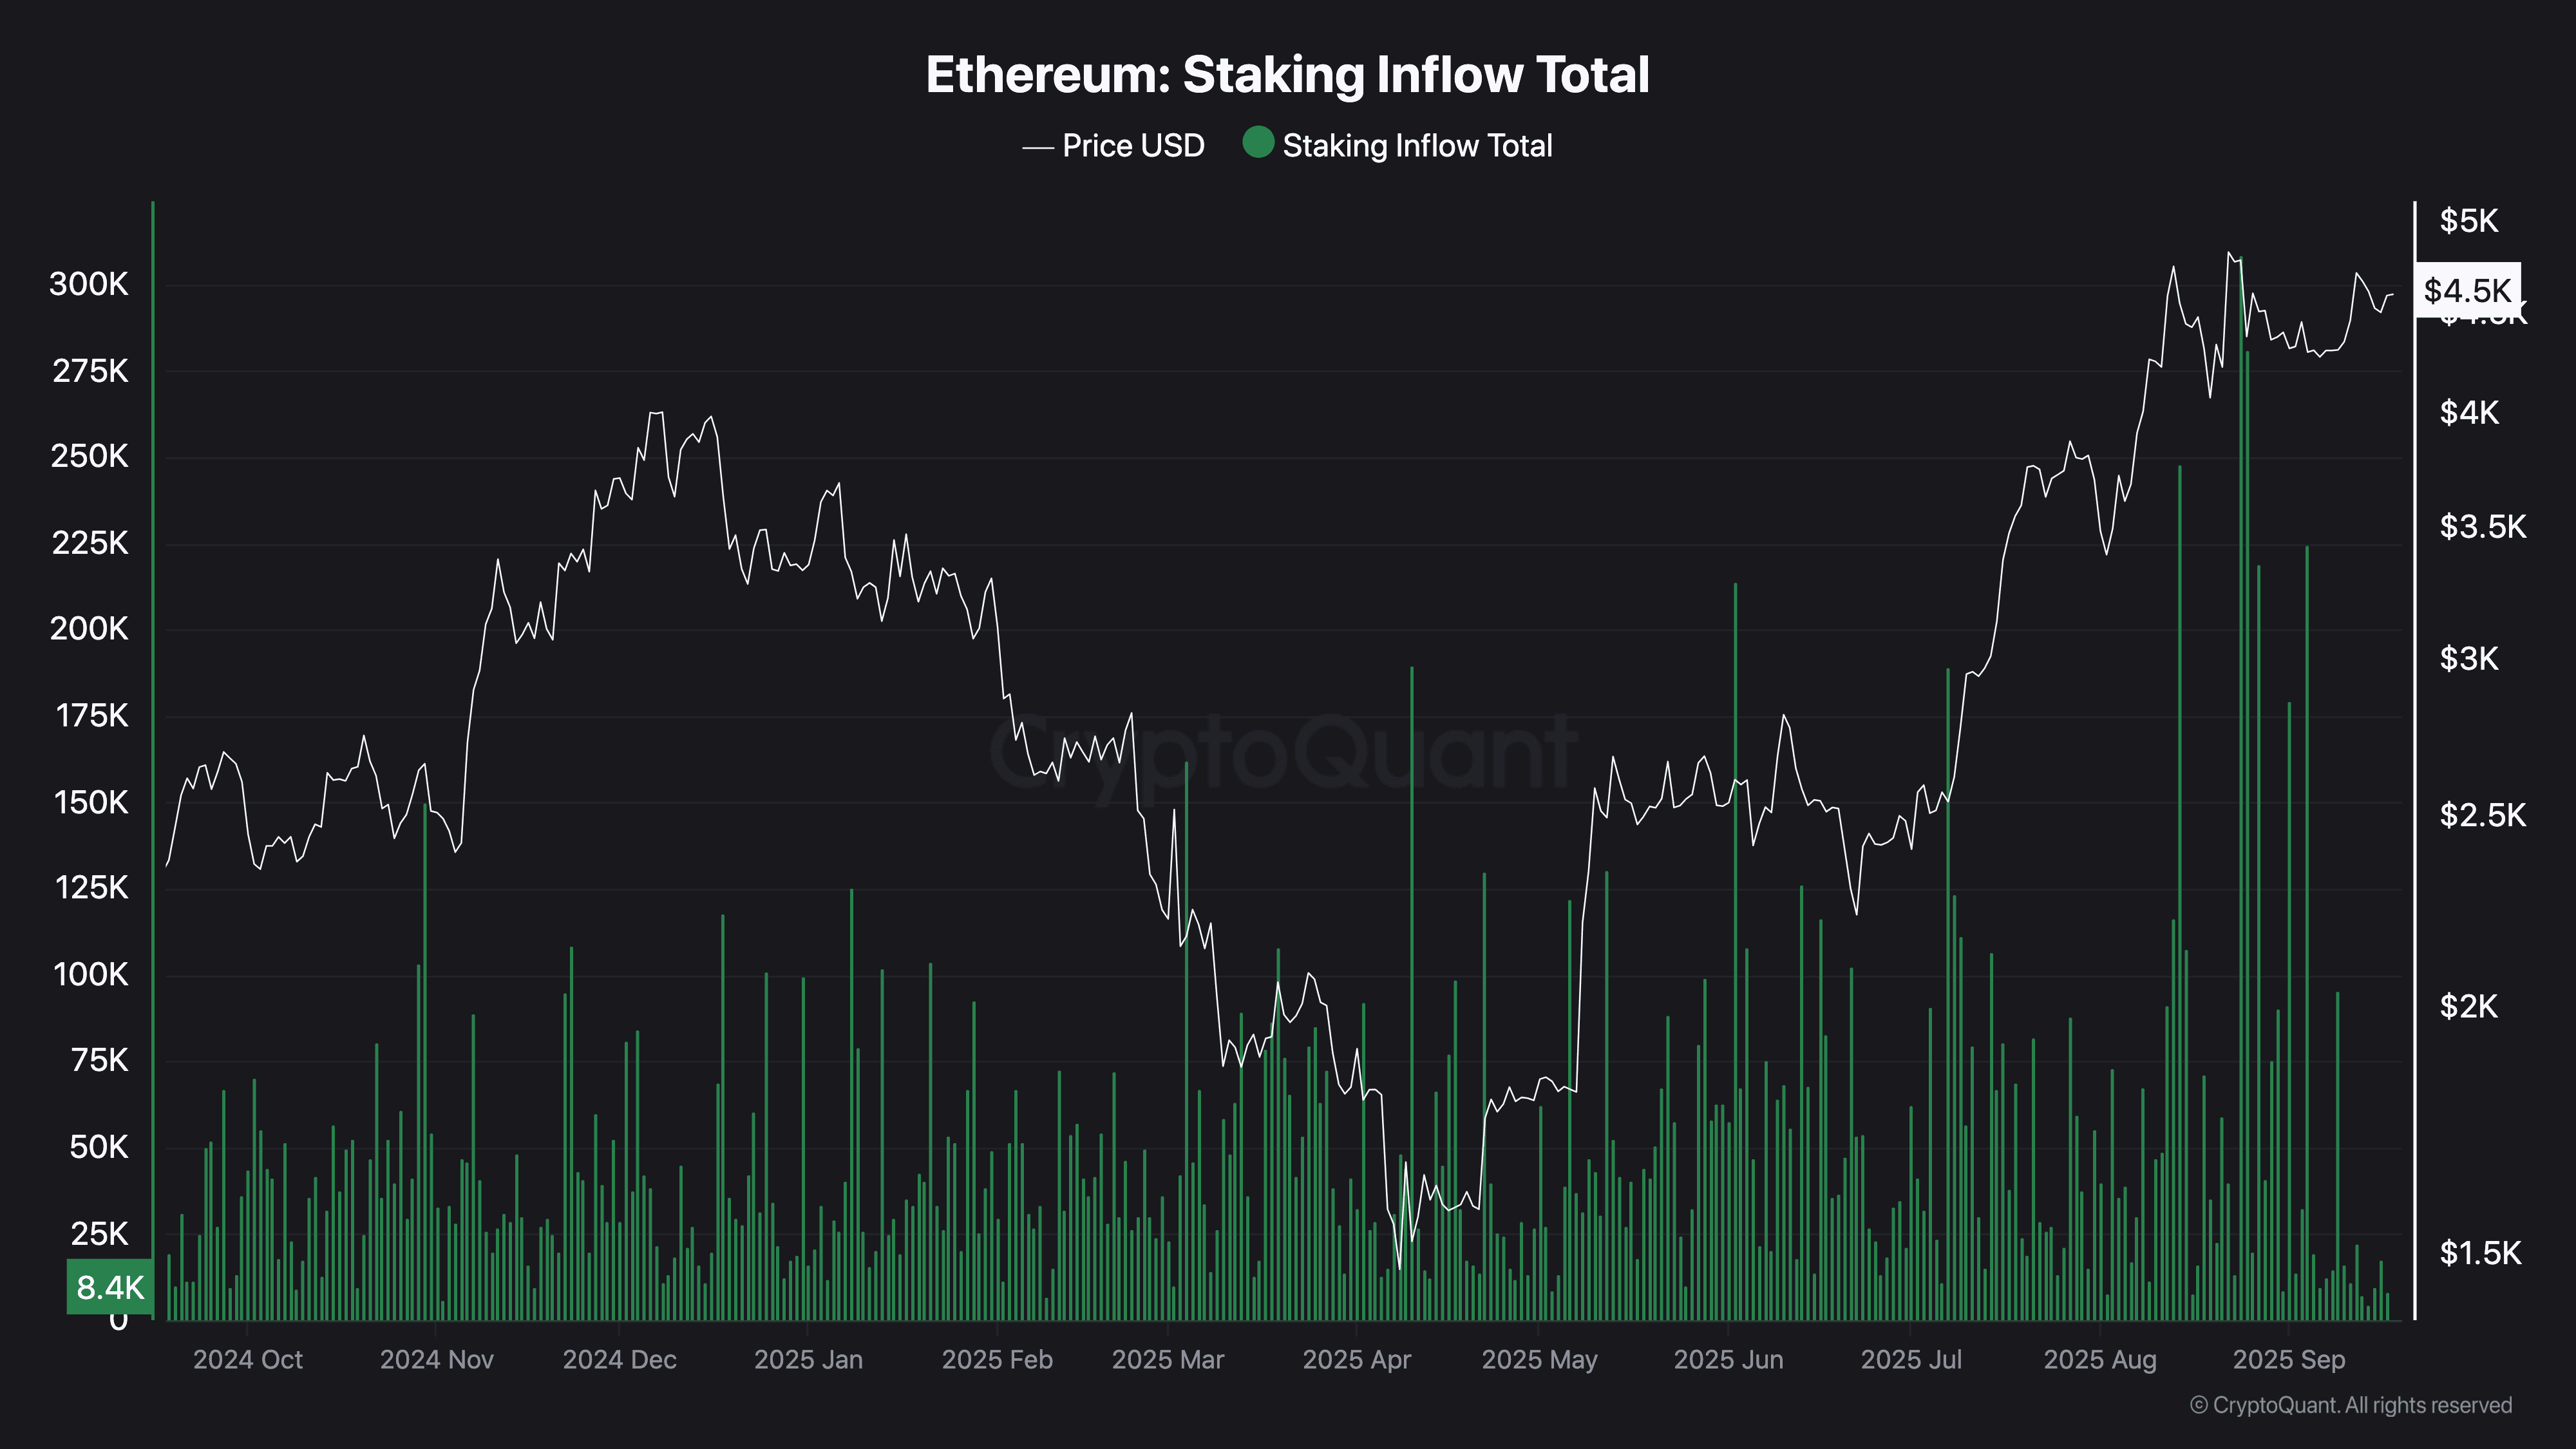
In late 2024 and the first half of 2025, daily displays of staking deposits would range from 20,000 to 100,000 ETH in amount. November 2024 and March 2025 saw some massive spikes, with ETH trading between $2,000 and $2,500.

Big inflows began around mid-2025, as ETH had formed a bottom in April. In August, there were days with staking inflows between 250,000 and 300,000 ETH, the largest in that year. As deposits came in substantial sizes with ETH going above $4,000, this is probably reflective of a stronger commitment to the network on the part of participants.

Ethereum Staking Inflow Total (1)Source: CryptoQuant

However, the latest data shows a sharp decline. In September 2025, staking inflows dropped to around 8,400 ETH, based on current chart readings. This marks the lowest daily level since late 2024. The recent pullback could reflect a cooling period after heavy deposits in the previous month.

ETH Approaches Key Price Level

At press time, ETH was trading around $4,600. It has gained over 4% in the past seven days and is approaching its previous all-time high. This level is now acting as resistance.

A report by Milk Road noted,

In the last cycle, ETH rose by over 240% after breaking through its old highs. If the same pattern occurs again, the price could move toward $16,500.

For now, traders are watching whether ETH can hold current levels and close above resistance. If it does, a new upward phase could follow. If not, the market may remain in consolidation until further signals appear.

The post ETH Whales’ Profits Hit Records: Massive Rally or Big Price Drop Next? appeared first on CryptoPotato.

Opportunità di mercato
Logo Ethereum
Valore Ethereum (ETH)
$2,182.79
$2,182.79$2,182.79
-5.75%
USD
Grafico dei prezzi in tempo reale di Ethereum (ETH)
Disclaimer: gli articoli ripubblicati su questo sito provengono da piattaforme pubbliche e sono forniti esclusivamente a scopo informativo. Non riflettono necessariamente le opinioni di MEXC. Tutti i diritti rimangono agli autori originali. Se ritieni che un contenuto violi i diritti di terze parti, contatta [email protected] per la rimozione. MEXC non fornisce alcuna garanzia in merito all'accuratezza, completezza o tempestività del contenuto e non è responsabile per eventuali azioni intraprese sulla base delle informazioni fornite. Il contenuto non costituisce consulenza finanziaria, legale o professionale di altro tipo, né deve essere considerato una raccomandazione o un'approvazione da parte di MEXC.

Potrebbe anche piacerti

Stripe and Paradigm’s Tempo mainnet goes live for machine payments

Stripe and Paradigm’s Tempo mainnet goes live for machine payments

Stripe and Paradigm launch Tempo’s mainnet and the Machine Payment Protocol, targeting high-speed, stablecoin-based payments for AI agents and global enterprises
Condividi
Crypto.news2026/03/18 21:43
Fed Acts on Economic Signals with Rate Cut

Fed Acts on Economic Signals with Rate Cut

In a significant pivot, the Federal Reserve reduced its benchmark interest rate following a prolonged ten-month hiatus. This decision, reflecting a strategic response to the current economic climate, has captured attention across financial sectors, with both market participants and policymakers keenly evaluating its potential impact.Continue Reading:Fed Acts on Economic Signals with Rate Cut
Condividi
Coinstats2025/09/18 02:28
NZD/USD is likely to trade with a downward bias – UOB Group

NZD/USD is likely to trade with a downward bias – UOB Group

The post NZD/USD is likely to trade with a downward bias – UOB Group appeared on BitcoinEthereumNews.com. New Zealand Dollar (NZD) is likely to consolidate in a range of 0.5870/0.5920. In the longer run, slight increase in downward momentum suggests NZD is likely to trade with a downward bias, potentially testing 0.5850, UOB Group’s FX analysts Quek Ser Leang and Peter Chia note. Slight increase in downward momentum 24-HOUR VIEW: “In the early Asian session yesterday, when NZD was at 0.5935, we highlighted the following: ‘While NZD subsequently rose and reached a high of 0.6007, it dropped sharply from the high and continued to decline in the early Asian session today. The decline could test the support at 0.5910 before stabilising. The major support at 0.5880 is unlikely to come into view.’ We did not anticipate the rapid downward acceleration, as NZD plummeted to a low of 0.5873. The sharp drop appears excessive, but it is too soon to expect a recovery. Today, we expect NZD to consolidate, most likely in a range of 0.5870/0.5920.” 1-3 WEEKS VIEW: “After holding a positive NZD outlook for more than a week, we stated yesterday (18 Sep, spot at 0.5935) that ‘the outlook for NZD is no longer positive, but neutral.’ We also indicated that ‘for the time being, we expect NZD to trade in a range between 0.5880 and 0.5980.’ We did not expect the subsequent sharp drop in NZD which dropped below 0.5880 (low was 0.5873). Downward momentum is increasing, but not significantly. From here, NZD is likely to trade with a downward bias, potentially testing the 0.5850 level. On the upside, if NZD breaks above 0.5945, it would indicate that the current downward pressure has eased.” Source: https://www.fxstreet.com/news/nzd-usd-is-likely-to-trade-with-a-downward-bias-uob-group-202509191132
Condividi
BitcoinEthereumNews2025/09/20 00:22