

Litecoin Price Prediction: LTC Faces a Make-or-Break Moment at a Historic Level
Key highlights:
- The LTC price is now testing a 9-year trendline, which has supported Litecoin's lows since 2017.
- Litecoin is still way down at 89% below its all-time high, with its market cap dropping from $4.05 billion to $3.52 billion.
- Traders keep an eye on the $42-$43 support zone because holding there could lead to a rebound towards $48-$52.
Litecoin just hit a super crucial level, maybe the most significant in years. For most of this cycle, the LTC price trailed the crypto herd. Now, it's testing a trendline that's been there for every main low since 2017, so this could be big.
Traders are watching closely because this isn’t just another support level. The LTC price is trading around the same long-term trend support that helped launch previous multi-year rallies. If buyers hold this zone, it could become the foundation for a recovery. If it breaks, Litecoin could enter a much deeper correction.
The LTC price is testing a 9-year trendline
Crypto analyst Eric Van Tassel recently pointed out that Litecoin is trading directly around its long-term trend support. His macro chart shows the same support line holding through multiple market cycles, including the 2018 bear market and the decline that followed Litecoin’s 2021 peak near $419.
He also noted that brief dips below major support aren’t unusual near market bottoms. These moves can flush out leveraged traders and weak hands before price moves back above support. In Litecoin’s case, a drop toward the 0.786 Fibonacci level would put the LTC price roughly 20% below the current trendline.
A move that large would still fit within historical behavior. The bigger concern would be a decline toward the next major order block, which would put the LTC price roughly 45% below trend support.
Van Tassel argued that such a move would likely require a major market-wide event because there isn’t much technical justification for that kind of collapse under normal conditions. The key area everyone is watching is $42-$43, which has become the line separating a possible long-term recovery from a much deeper breakdown.
The LTC price is under heavy pressure
We checked the daily chart and saw that the LTC price is still in a strong downtrend. Recently, it broke below its 100-day moving average of $54.56, turning it into a major resistance level. The selling pressure has been pretty aggressive, too. The latest daily candles pushed Litecoin directly into the $42-$43 support zone, where buyers are trying to defend the market.
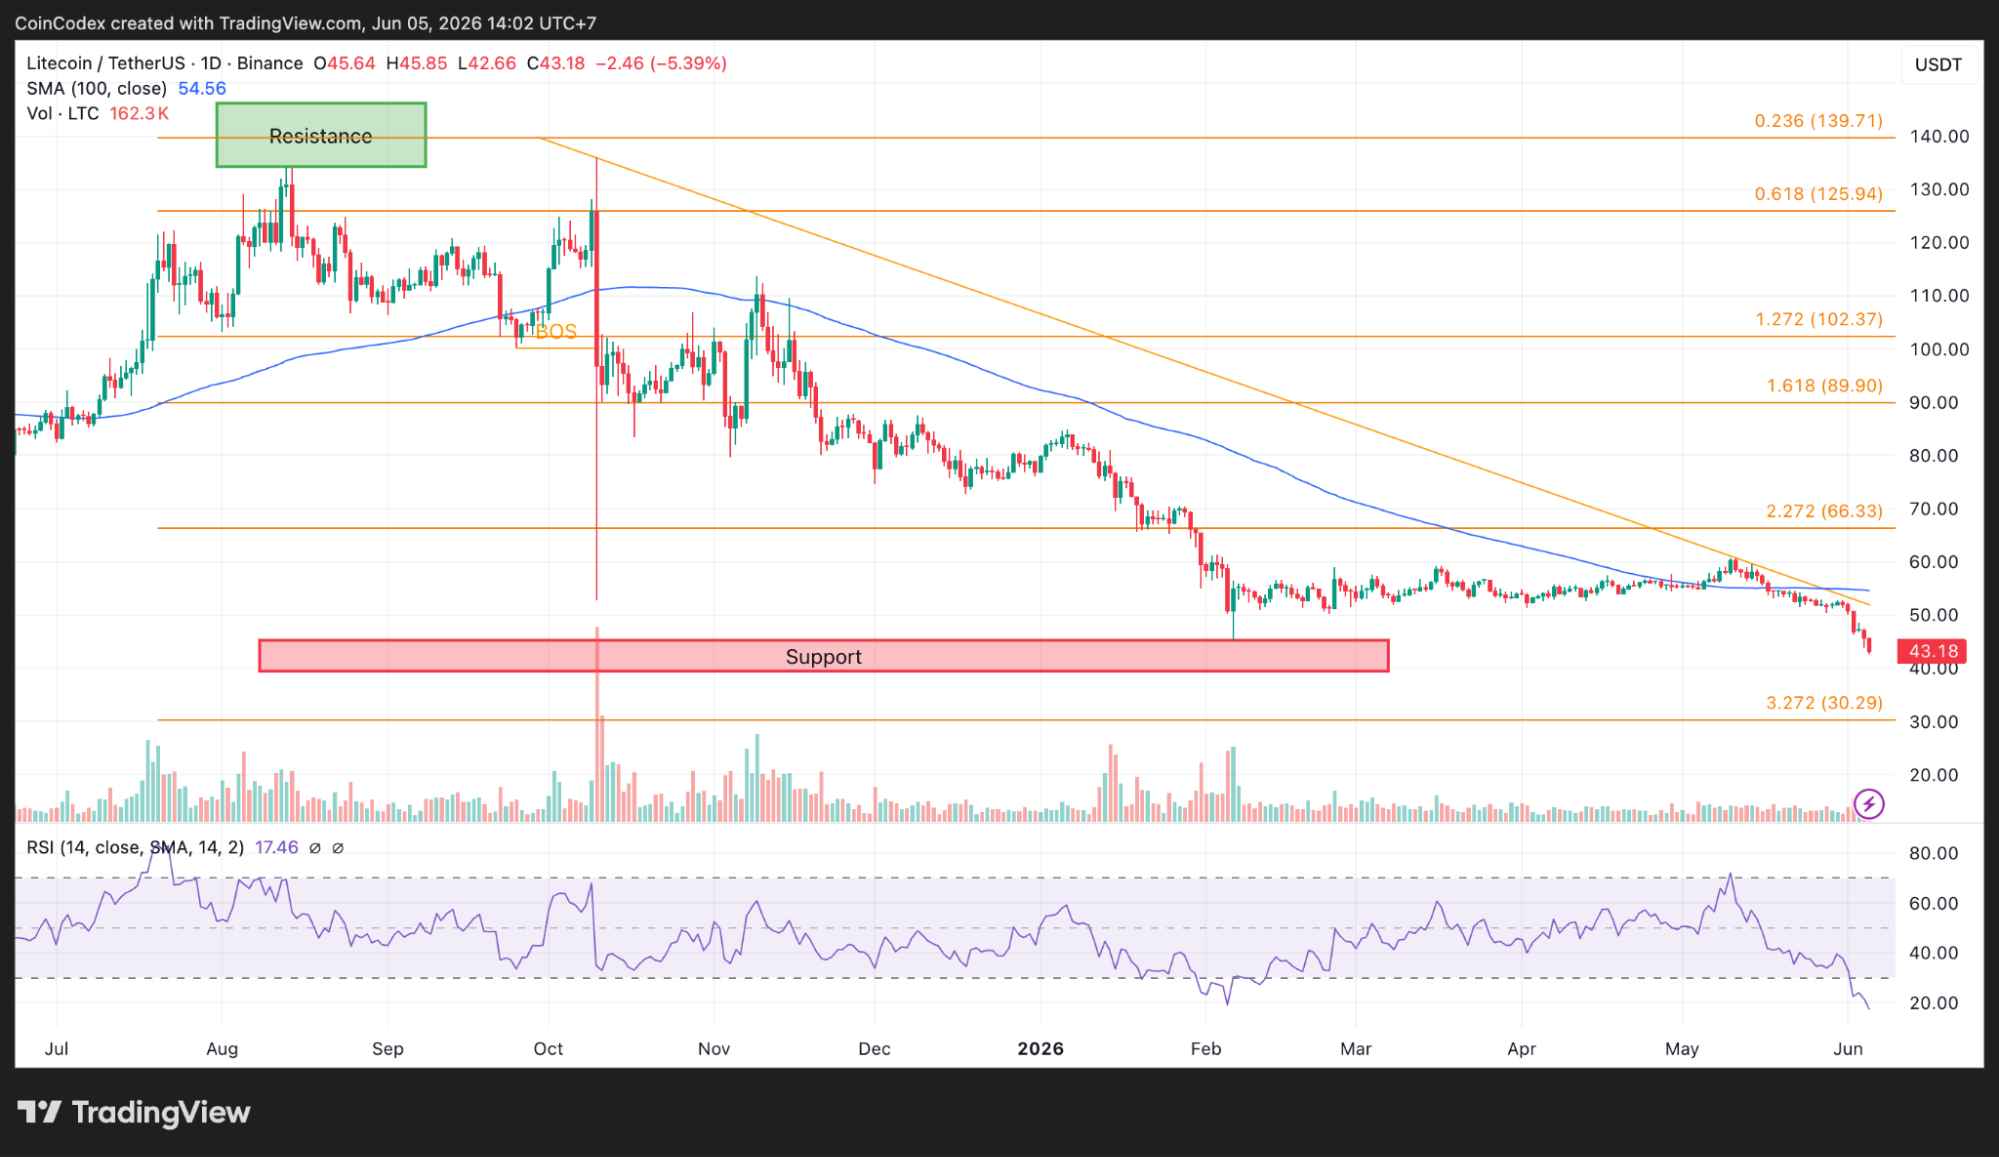
Daily LTC chart analysis
One thing that stands out is how oversold the market has become. The daily RSI dropped to 17.46, one of the lowest readings Litecoin has printed in a long time. Readings that low don’t guarantee a bottom, but they often show up when selling pressure starts reaching extremes.
We also checked the 4-hour chart, and the picture is similar. The LTC price is still trading below the 100-period moving average near $51.55 after printing a clear bearish break of structure. The RSI on that timeframe has fallen to 19.26, which shows short-term selling has become heavily stretched.
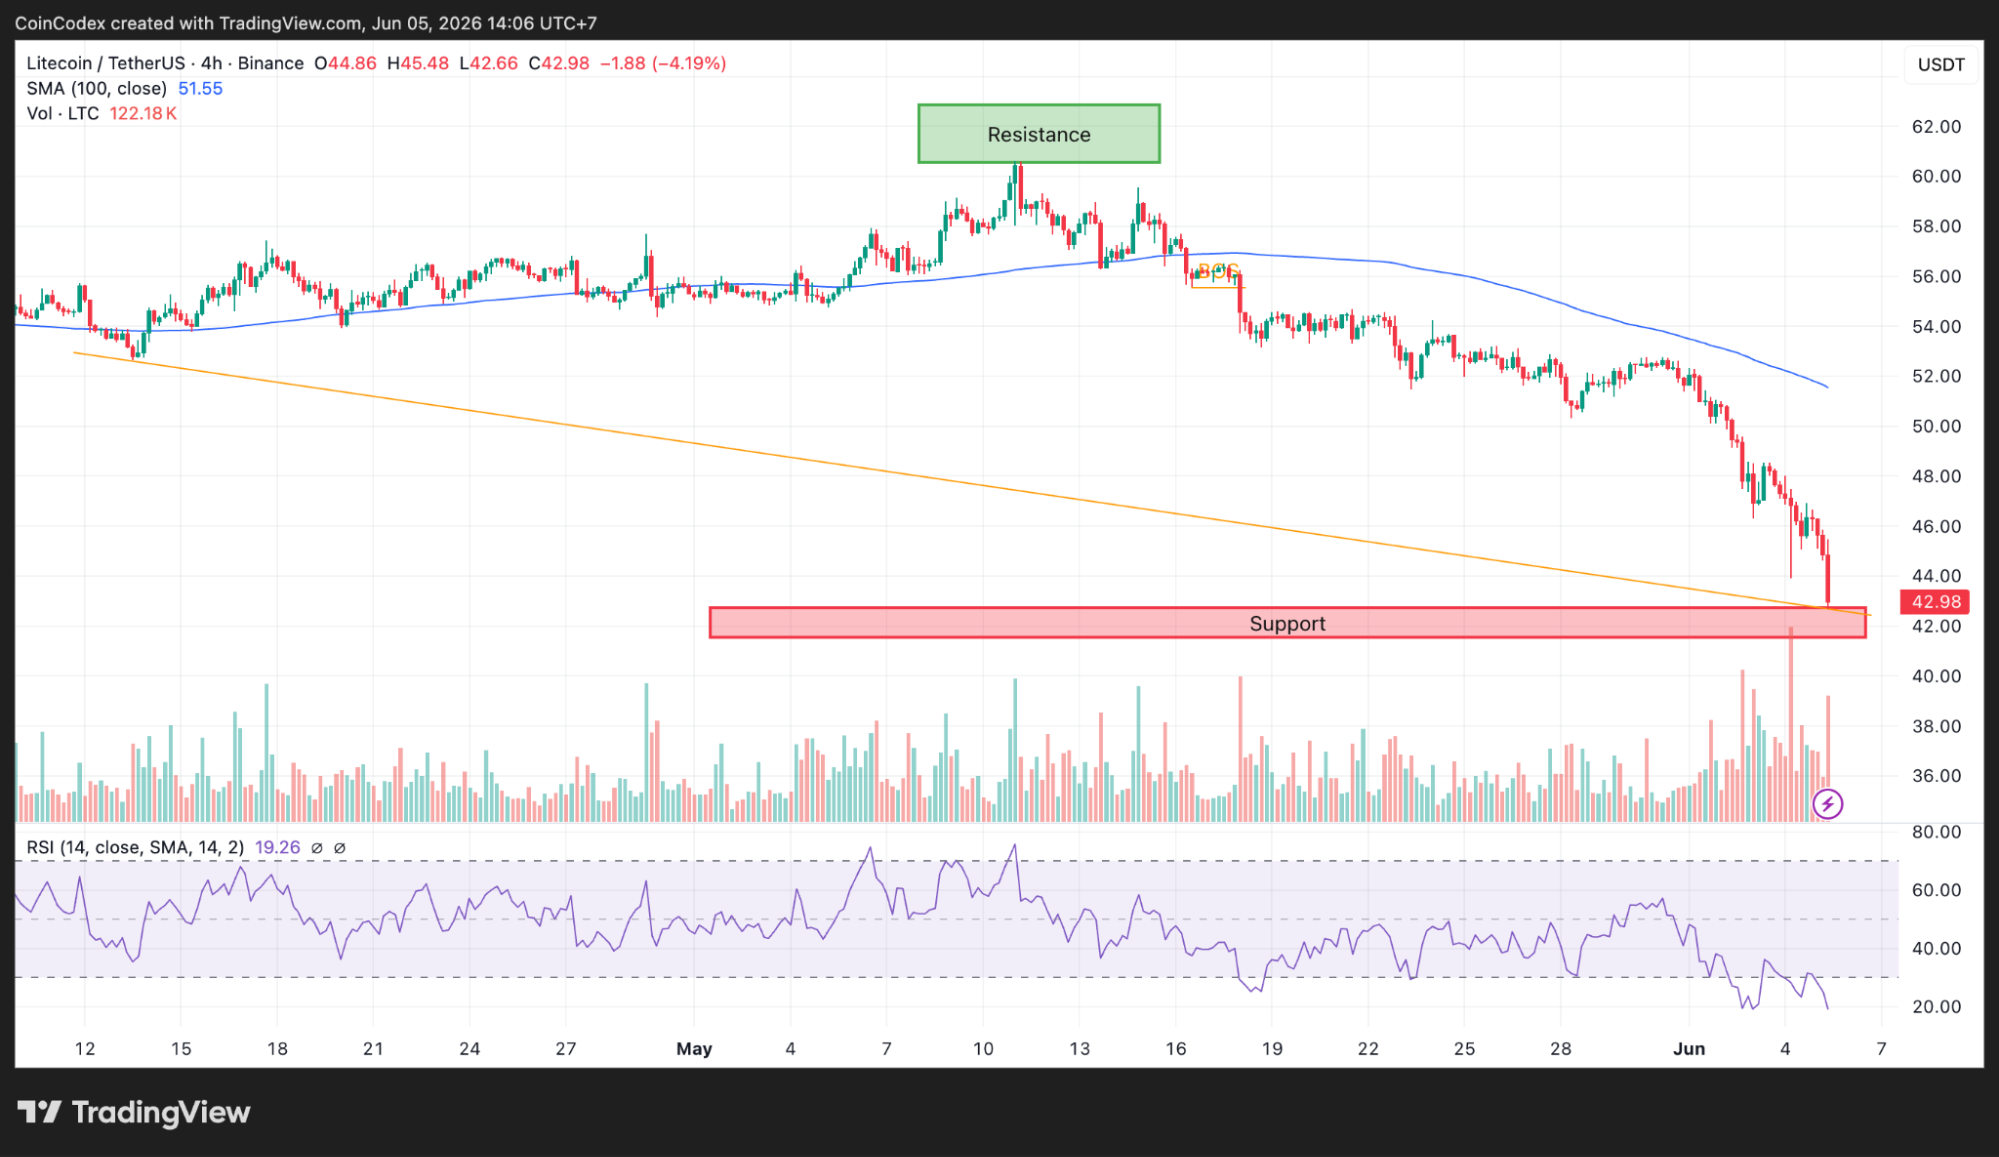
4-hour LTC chart analysis
If buyers can hold the $42-$43 support zone, many traders will look for a relief rally toward the $48-$52 area. If support fails, the next downside target sits closer to $40.
On-chain data still looks weak
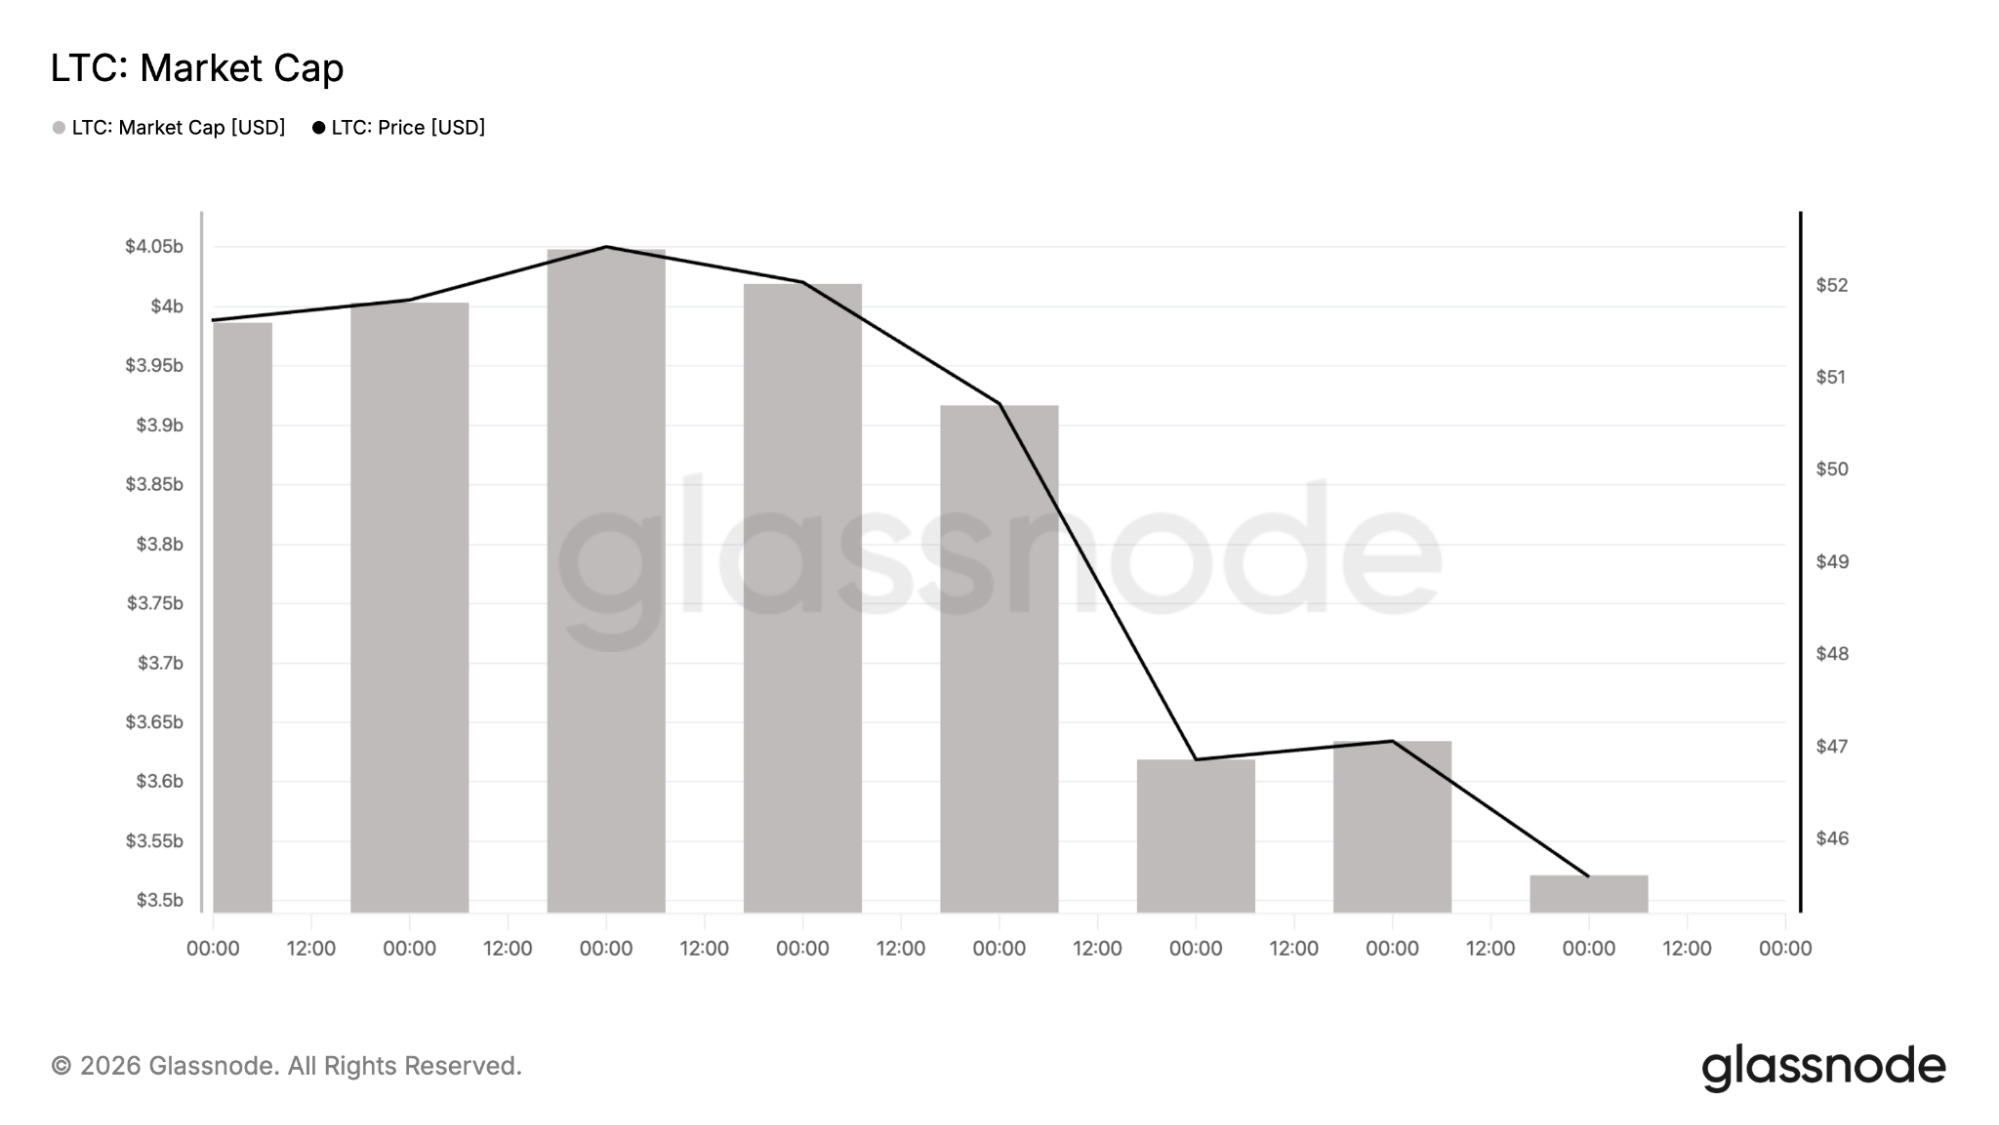
The technical weakness is also showing up in Litecoin’s on-chain metrics. Glassnode data shows Litecoin’s market capitalization falling to roughly $3.52 billion after peaking near $4.05 billion earlier in the period. That’s more than $500 million in lost market value over a relatively short timeframe.
The drawdown data looks even tougher. Litecoin remains roughly 89% below its all-time high. Very few established cryptocurrencies remain that far below previous cycle peaks this late in a market cycle.
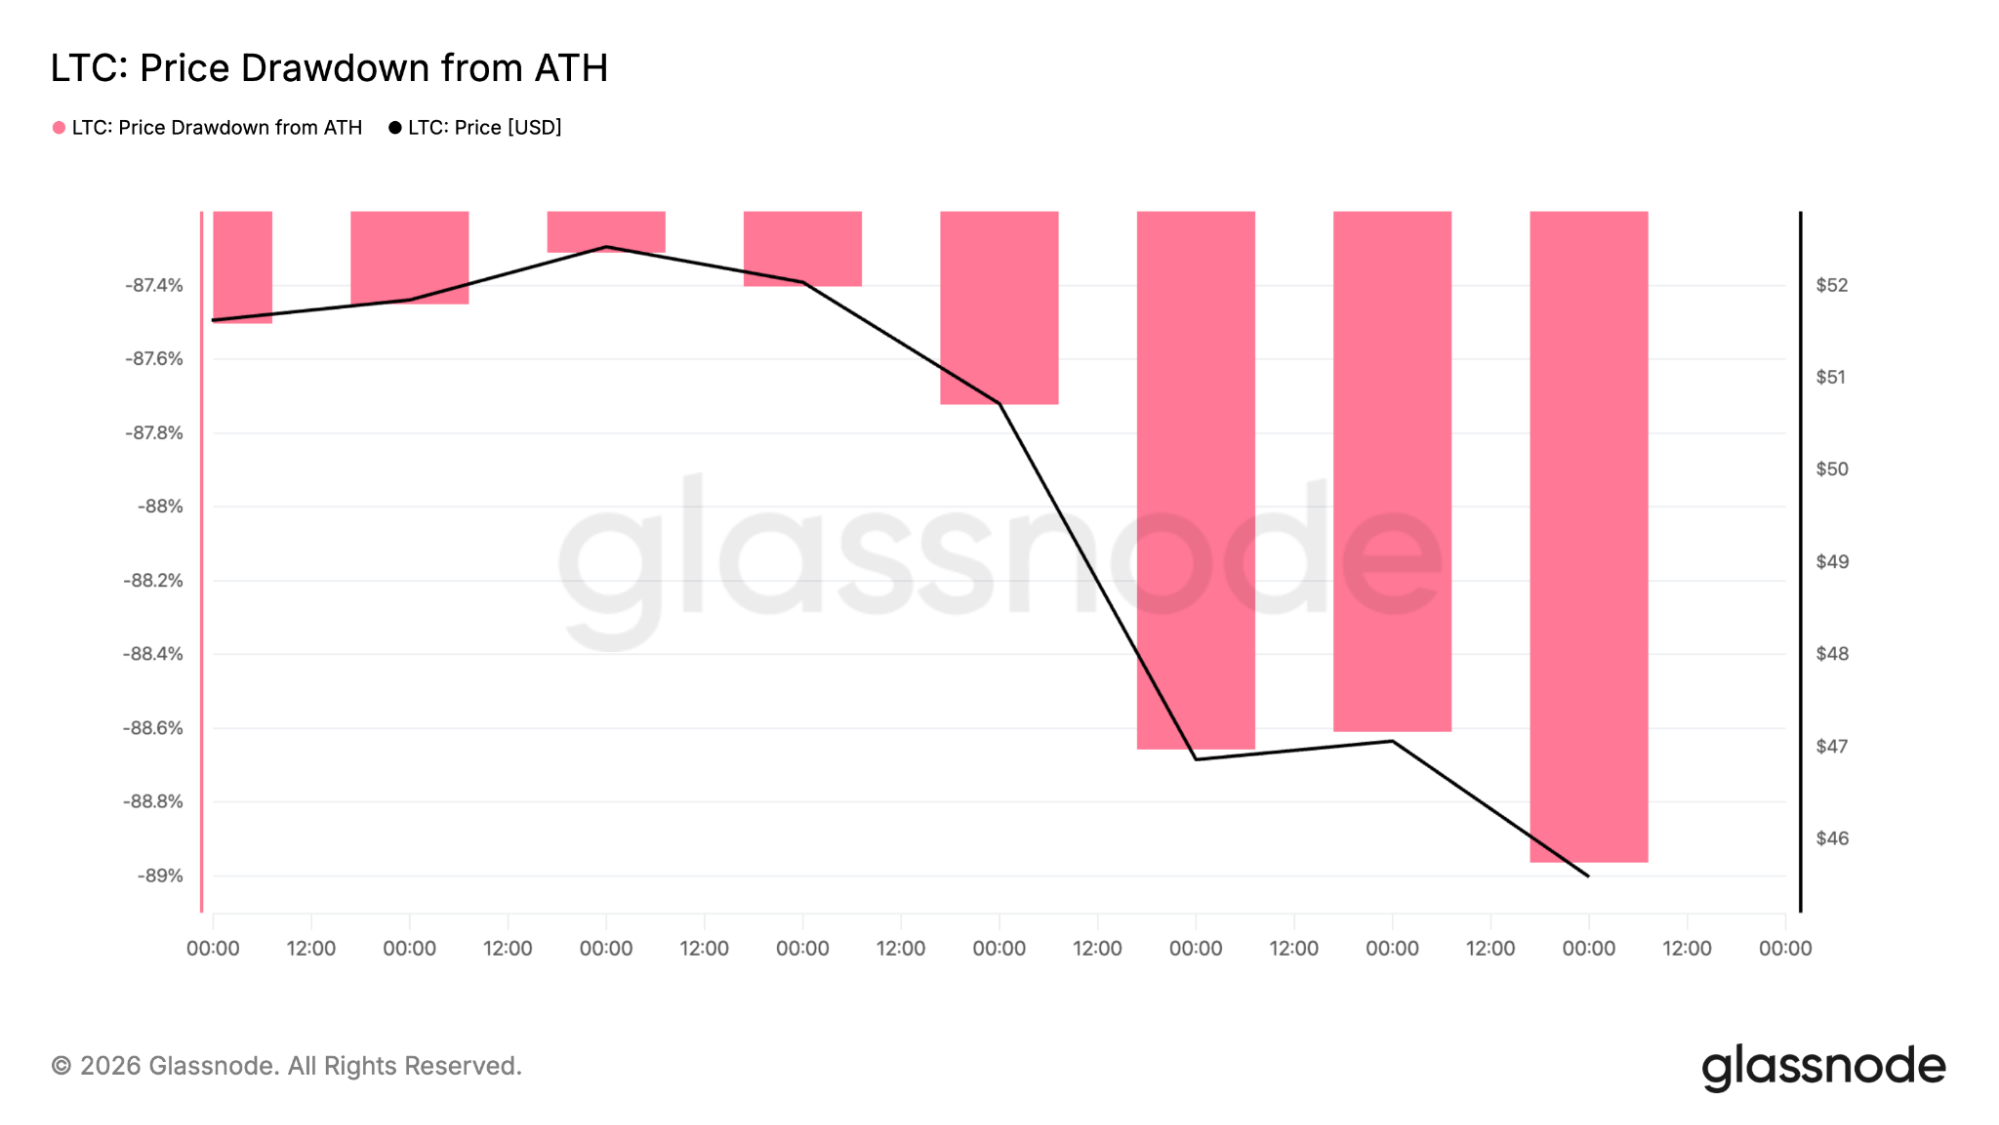
For some investors, that level of underperformance raises concerns about Litecoin’s ability to compete for capital against newer blockchain ecosystems. For others, it creates a potential value opportunity if the long-term support structure survives.
Litecoin still has some long-term catalysts
Even with the weak chart structure, Litecoin still has a few developments that investors are watching. One of the biggest is the next Litecoin halving, expected around July 2027. The event will cut block rewards from 6.25 LTC to 3.125 LTC, reducing the rate of new supply entering the market.
Historically, halving cycles tend to attract attention because they create a supply shock. Many investors start positioning well before the actual event, which is why the halving conversation is already happening despite being more than a year away.
Another development comes from LitVM, an initiative designed to bring Ethereum-compatible smart contract functionality to Litecoin through a zk-powered Layer 2 network. The idea is to connect Litecoin to DeFi applications and broader blockchain activity without changing Litecoin’s base-layer security model.
If adoption develops successfully, it could create new sources of demand that Litecoin has historically lacked. The challenge, of course, is competing against much larger smart contract ecosystems that already dominate developer activity and user adoption.
Can the LTC price hold this critical support?
The coming weeks could be huge for Litecoin. A lot rides on whether it stays above $42 to $43. If buyers hold that line, we could see Litecoin bounce back big time. It would be helped by its oversold status and longtime price support.
Traders would likely focus on reclaiming the $48-$52 region first before targeting the larger resistance area between $54 and $55. The bearish case becomes much more serious if support fails.
CoinCodex’s 1-month LTC price prediction places the price at $51.50, which is above current levels and indicates that some analysts expect a recovery rally from Litecoin’s recent weakness if key support around the $42-$43 zone continues to hold.


You May Also Like

Strategy’s Bitcoin Sale Sparks Debate Over Treasury Model and Future Buying Pace

Fetterman caves to Trump on PA judge after moaning he’s been burned by president

From Private Deals to Public Tokens: IPO Genie’s Path for Retail Investors


