$DOGE Accumulation Trend Grows as Investors Await Broader Crypto Rally
DOGE accumulation grows near $0.1089 as investors watch Fibonacci levels, momentum signals, and broader crypto trends.
Dogecoin investors are watching lower price zones as DOGE trades near $0.1089. The token has shown a short-term recovery, while the wider trend remains cautious.
Market analysts are tracking accumulation, support levels, and momentum signals as they wait for stronger conditions across the broader crypto market.
DOGE Holders Focus on Long-Term Accumulation
DOGE investors often focus on long-term accumulation during lower price periods. Many position ahead of broader market bull cycles or major sentiment catalysts.
This approach reflects Dogecoin’s past market behavior. Price momentum has often followed strong community support and wider crypto market trends.
High-profile endorsements have also affected DOGE trading activity in past cycles. Because of this, patience and timing remain key factors for investors.
The current DOGE price has drawn attention because it remains far below past highs. Some holders may view lower levels as possible accumulation zones.
DOGE was trading near $0.1089 on the daily chart. The token also showed a small daily gain of about 0.38%.
The move followed a rebound from a lower Fibonacci support area. This suggests that buyers have defended a key short-term zone.
Fibonacci Levels Define the Next Move
The chart shows DOGE below the main retracement zone from $0.1819 to $0.0838. This keeps the wider trend under pressure.
Still, DOGE has moved back above the 0.786 Fibonacci level near $0.1061. That level is now important for short-term direction.
If price holds above $0.1061, buyers may target the next resistance near $0.1237. That area marks the 0.618 Fibonacci level.
A move above $0.1237 could bring $0.1359 into focus. The next major resistance after that stands near $0.1483.
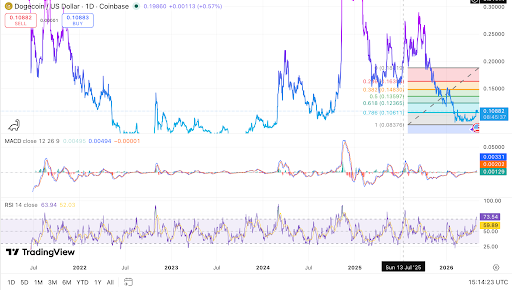 Dogecoin daily chart shows recovery near Fibonacci support. Source: TradingView.
A daily close above $0.1483 would improve the DOGE chart structure. It would also show stronger buyer control.
If DOGE loses $0.1061, the recent recovery may weaken. The next major support is near $0.0838.
Read Also:
Momentum Improves as Broader Rally Remains Key
The MACD indicator shows improving short-term momentum. The MACD line is above the signal line, and the histogram is positive.
This suggests that buying activity has increased during the recent bounce. However, the move still needs stronger follow-through.
The RSI is near 73.63 on the daily chart. This places DOGE in overbought territory and may lead to cooling.
A pullback that holds above $0.1061 would keep the recovery structure intact. A move below that level would weaken it.
Dogecoin’s next move may also depend on the wider crypto market. A stronger market rally could support renewed demand for DOGE.
For now, the DOGE outlook remains neutral to cautiously bullish in the short term. Accumulation interest is growing, but resistance levels still matter.
The post $DOGE Accumulation Trend Grows as Investors Await Broader Crypto Rally appeared first on Live Bitcoin News.


You May Also Like

BTC and XRP Price Predictions Fade Out, but APEMARS Starts Drawing the Next Wave of Attention Among Top Crypto Coins

Riot Platforms (RIOT) Shares Surge 7% on Strong Q1 Performance and Data Center Launch