

Altcoin Market Loses $520B as 83% Trade Below 200-Day Average
Key Insights:
- Nearly 83% of Binance-listed altcoins sit below their 200-day moving averages.
- TOTAL3 has erased almost $520 billion since October 2025, sliding toward $670 billion.
- The CMC Altcoin Season Index stands at 42, still outside altcoin season territory.
Altcoins are under broad pressure as market breadth hits one of its weakest points this cycle. Most Binance-listed assets now trade below their 200-day moving averages, showing that weakness is spread across the sector. The move comes as Bitcoin falls, risk appetite fades, and momentum leaves the wider crypto market.
At the same time, some traders see the current stress as a possible late-cycle reset. Charts tracking altcoin strength against Bitcoin show long accumulation zones, but confirmation remains missing as capital continues to favor defensive positioning.
Altcoin Breadth Falls to Cycle Lows
Altcoin market conditions remain difficult as nearly 83% of Binance-listed altcoins now trade below their 200-day moving average. The reading shows that most tokens are still under long-term trend pressure, even after several months of attempted rebounds.
The chart shared by Darkfost showed this breadth measure sitting near one of its weakest areas of the current cycle. This reflects a broad market problem, not just weakness in a few isolated assets. When most altcoins trade below their 200-DMA, investors often view the sector as technically damaged.
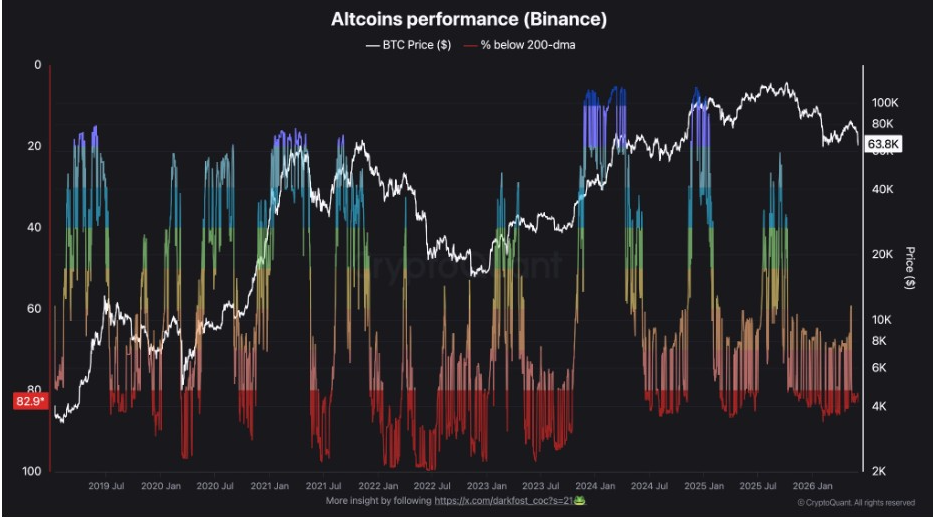 Altcoins’ Performance | Source: CryptoQuant, X
Bitcoin also fell nearly 4%, while the S&P 500 declined 2.6% and the Nasdaq dropped 4.7%. Weakness in tech, AI, and semiconductor stocks has also weighed on risk assets. Crypto often feels that pressure quickly, especially altcoins with thinner liquidity.
Since October 2025, about 60% to 90% of altcoins have stayed below their 200-day moving averages. That shows how difficult it has been for the sector to build a lasting recovery.
Altseason: TOTAL3 Drops By $520B
Meanwhile, TOTAL3 has lost nearly $520 billion over the same period. The index, which tracks altcoins excluding Bitcoin and Ethereum, has fallen toward $670 billion. That puts it back near levels last seen around November 2024.
This decline shows how much value has been left in smaller and mid-sized crypto assets. It also explains why sentiment around altcoins remains weak despite occasional short rallies in selected tokens.
However, extreme breadth weakness can also signal areas where long-term opportunities are beginning to form. Darkfost noted that similar pessimism appeared in March and December 2024, when nearly 90% of altcoins were below their 200-DMA. Those periods later produced stronger rebounds.
Even so, timing remains difficult. A weak breadth reading alone does not confirm a bottom. Altcoins still need sustained demand, stronger liquidity, and improving Bitcoin-pair performance before a broader recovery becomes credible.
Altcoin/BTC Charts Show Accumulation
Additionally, charts tracking altcoins against Bitcoin show a possible accumulation structure. One chart of OTHERS/BTC shows altcoins still trading inside a long downtrend, but price has started to curl higher from a compressed range.
 OTHERS/BTC Chart | Source: Don, X
The chart shows altcoins trying to break out of a descending structure that has limited performance since the 2021 peak. If price holds above the accumulation zone, it could mark an early sign of capital rotating back into smaller assets.
Another chart of total market cap excluding the top 10 assets against Bitcoin showed a long-term trendline that supported previous altcoin cycle bases. Similar points appeared near the 2018 and 2021 altseason setups.
 Ratio Total Market Cap Excluding Top 10 to BTC | Source: X
For now, that comparison remains a technical signal, not confirmation. The market still needs follow-through. Without stronger volume and higher lows, the move can remain another failed rotation attempt.
Altcoin Season Index Still Below Key Zone
However, the CMC Altcoin Season Index sits at 42, which keeps the market outside full altcoin season territory. The index remains below the 75 level usually associated with broad altcoin outperformance.
 Altcoin Season Index | Source: X
The latest reading shows improvement from last week’s 33 and last month’s 40. Yet it is still not strong enough to confirm that altcoins are leading Bitcoin. Yesterday’s reading at 44 also shows that momentum remains uneven.
This matters since altcoin rallies often need broad participation. A few movers can improve sentiment for a while. Still, a real altcoin season usually requires broad, sustained outperformance across many tokens against Bitcoin.
The post Altcoin Market Loses $520B as 83% Trade Below 200-Day Average appeared first on The Market Periodical.


You May Also Like

Ethereum Whale Cohort Hits All-Time Low of 11.04M ETH Amid Sustained Distribution

Gold Market Weakens as 200-Day Moving Average Support Fails

Trump is the nightmare America needed to wake up


