

Ripple price today crashes to 1.16 USDT with risk of a new drop to 1.00
The situation of XRP leaves no room for romantic interpretations. The Ripple price today is at 1.16 USDT, crushed below every significant moving average and in a market context that shows no mercy. This is not an orderly technical correction: the bearish regime is consistent across all analyzed timeframes, and the downward momentum still shows no credible signs of exhaustion. Anyone looking for an updated Ripple value with concrete trading perspectives has to deal with an asset that, at this moment, is in the hands of sellers.
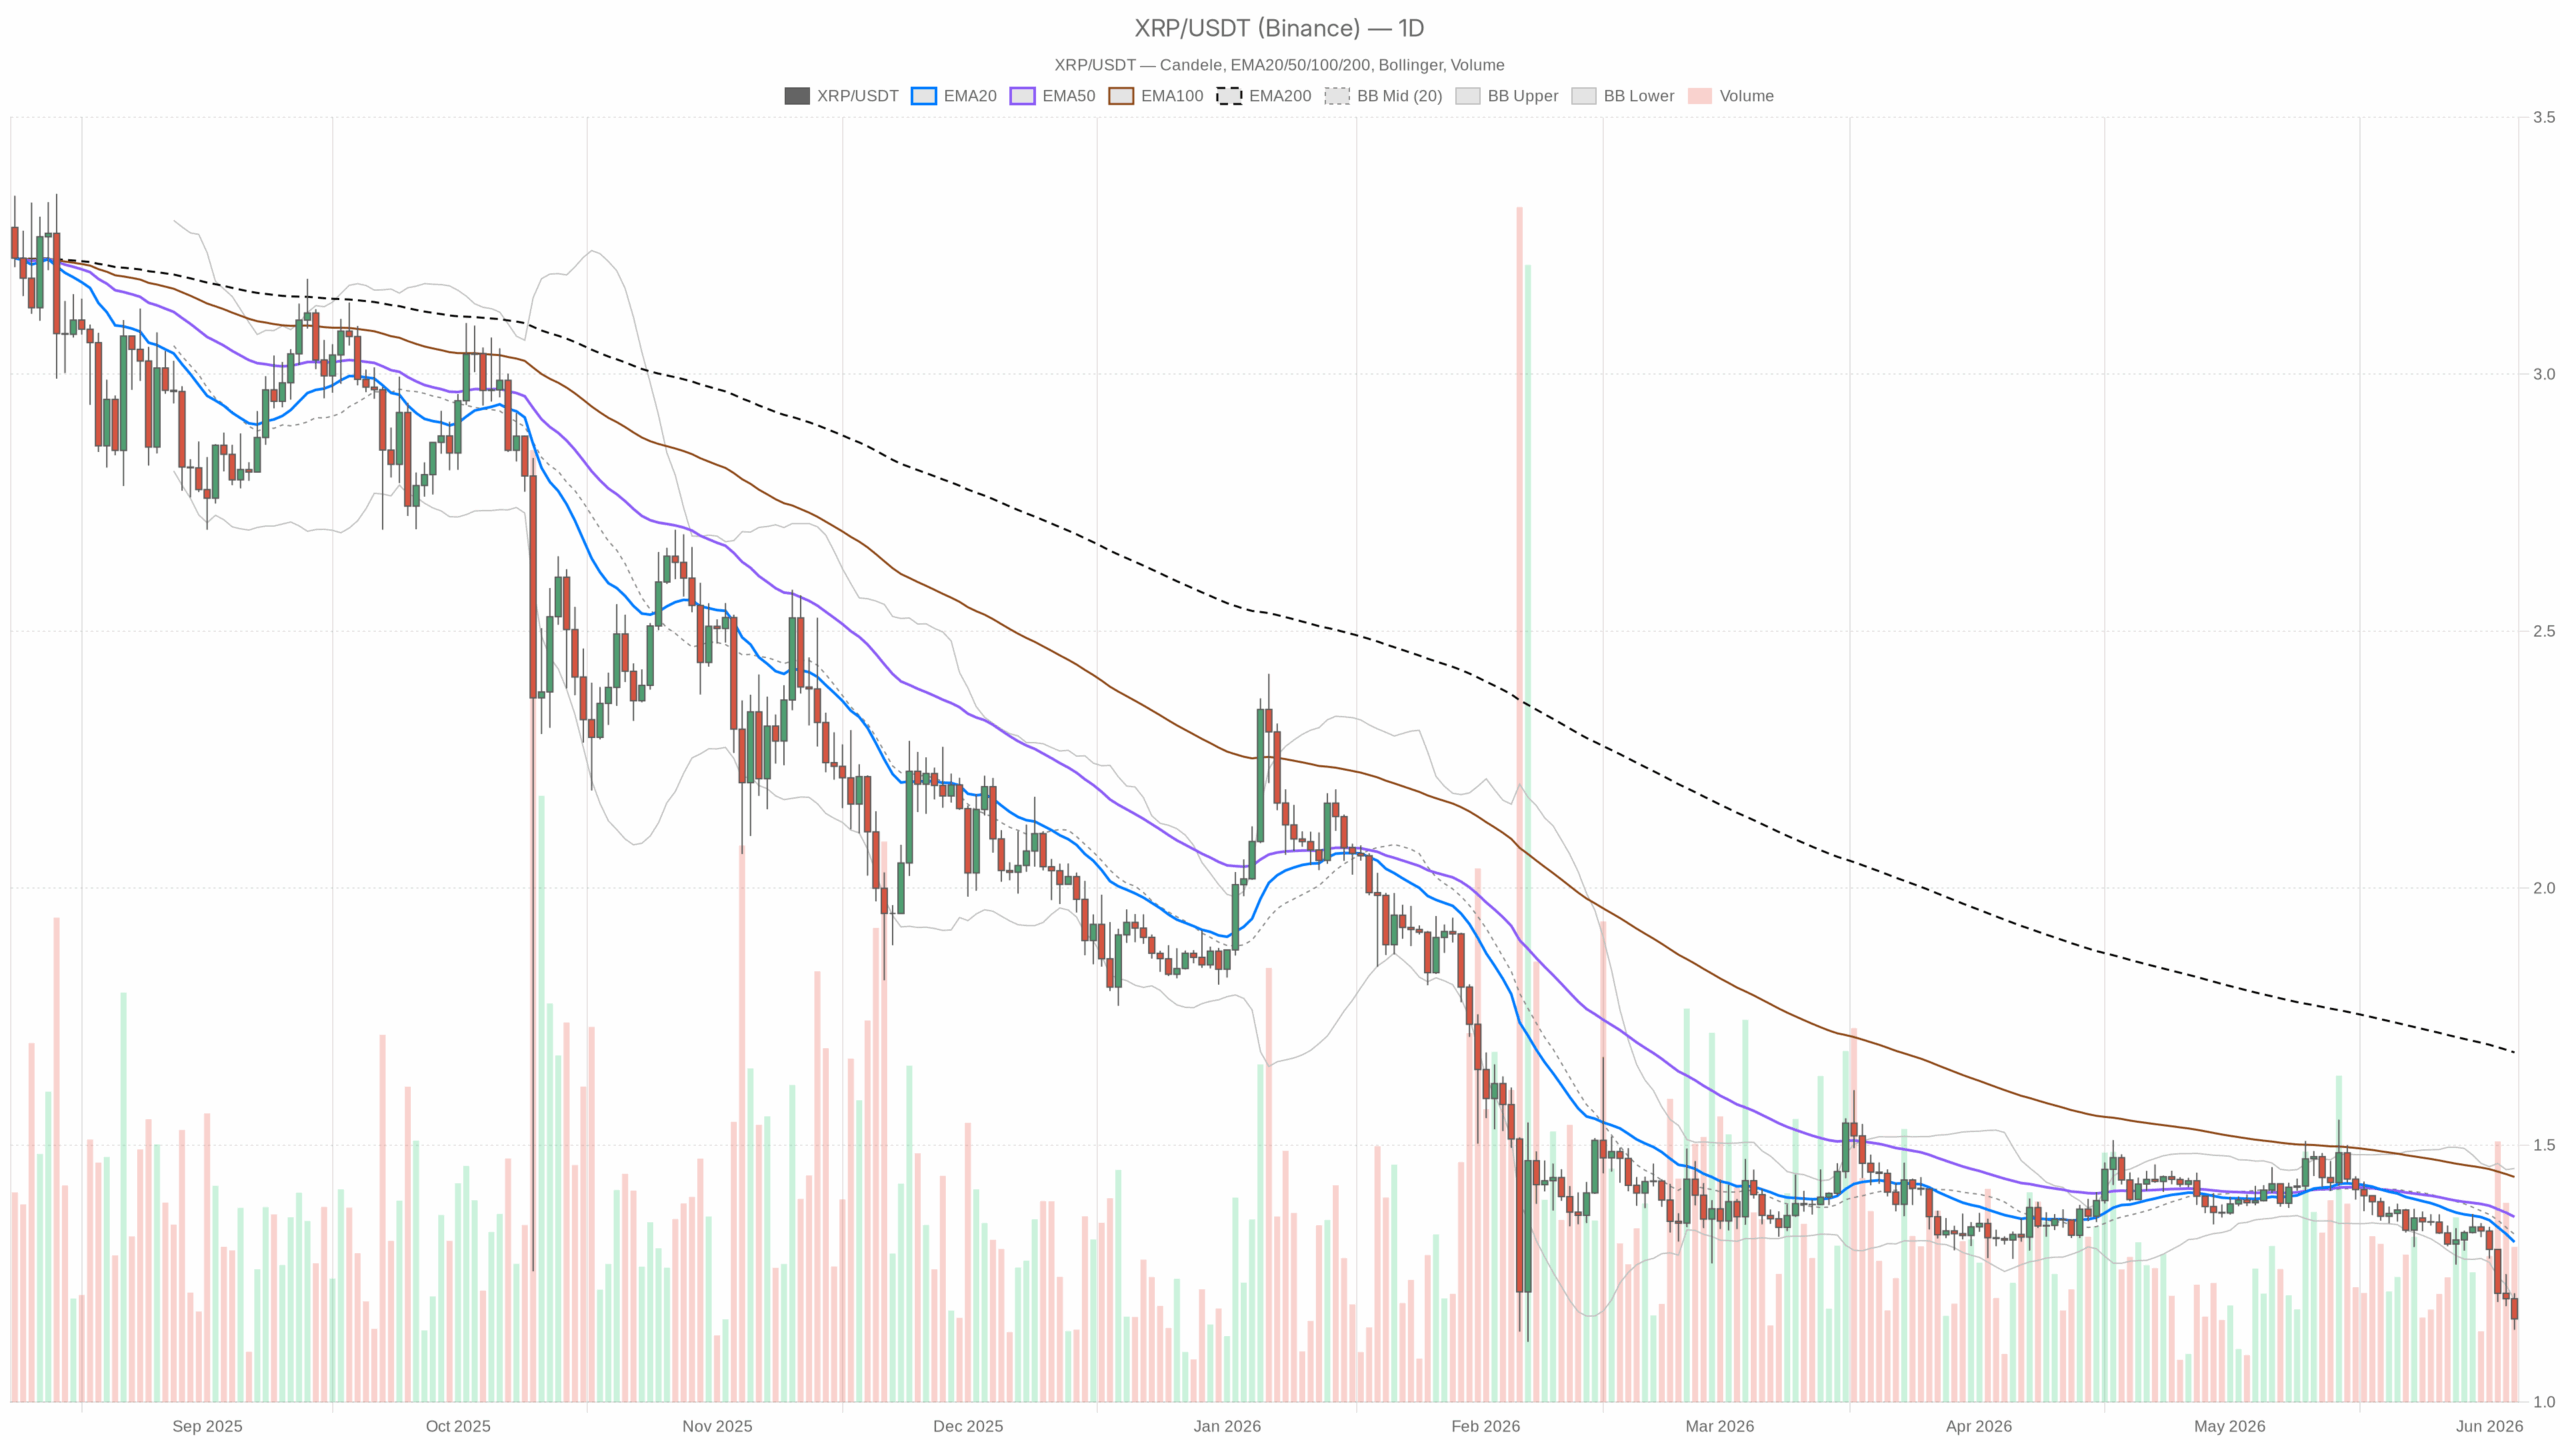 XRP/USDT — daily chart with candles, EMA20/EMA50 and volumes.
The daily structure says it all
On the daily timeframe, XRP closes at 1.16 USDT while the EMA20 is at 1.31 and the EMA50 at 1.36 — the current Ripple price is more than 10 cents away from the first relevant dynamic moving average. This distance is not a detail: it means the market is moving in a phase of acceleration to the downside, not of slow erosion. The EMA200 at 1.68 is now a distant memory, a level that captures how much sentiment has changed since the beginning of the year.
The 14‑period RSI on the daily has plunged to 22.92 — extreme oversold territory. Under normal conditions, this level could be read as a signal of an imminent rebound. However, in strongly directional trends, the RSI can remain in oversold territory for weeks. It is not a promise of reversal, but a warning that the selling pressure has been violent. The price is approaching capitulation levels, but capitulation does not automatically equal a bottom.
The daily MACD confirms this: line at -0.05, signal at -0.03, histogram at -0.02. There is no convergence nor any hint of bullish divergence. The two lines remain in negative territory with the histogram continuing to widen the bearish gap. The strength of the downward trend has not yet shown signs of exhaustion on this timeframe.
The daily Bollinger Bands show the price at 1.16 touching and pressing against the lower band at 1.20 — the real-time Ripple price is below the lower band, a sign of compressed volatility that has been released in the unfavorable direction for longs. The middle band at 1.33 and the upper band at 1.45 seem far away. The ATR at 0.05 indicates that daily candles move on average by 5 cents: a contained range, suggesting that the drop has been more structural than explosive.
The daily pivot levels confirm the fragility of the Ripple price today: the pivot point is at 1.17, resistance R1 at 1.20, support S1 at 1.13. The price is practically sitting on the pivot, with immediate resistance just above and support only 3 cents below. This compression of the pivot levels indicates that the market has little room to oscillate before touching the edges.
What the lower timeframes are saying
On the 1‑hour chart the situation does not improve. The EMA20 is at 1.19, the EMA50 at 1.22, the EMA200 at 1.28 — a structure of all declining moving averages and all above the current price. There is not a single dynamic level supporting XRP. The price is below everything. The hourly RSI at 35.09 is not yet in technical oversold, but it is visibly weak and shows no significant rebounds. The hourly MACD has a histogram at 0, which might seem neutral, but it captures a downward inertia that does not even find the strength to accelerate — a phase of fatigue after a drop, not of reversal.
The Bollinger Bands on the hourly chart show the price exactly on the lower band at 1.16, with the middle band at 1.20 as the first recovery target. The hourly pivots have R1 at 1.17 and S1 at 1.16: we are compressed in a 1‑cent range between pivot and support. Any move immediately becomes relevant.
On the 15‑minute chart the trading picture is consistent with what we have seen on the higher timeframes. The EMAs are all above the price (1.18, 1.19, 1.22), the RSI is at 35.02 — almost identical to the hourly, indicating that there has been no hidden divergence between the two timeframes. The MACD is flat, the ATR at 0.01 signals compressed short‑term volatility. The price is on the lower Bollinger band here as well, and the pivots show a very tight range between 1.16 and 1.17.
The three timeframes tell the same story: bearish, consistent, with no confirmed reversal signals. When daily, hourly and 15‑minute speak in unison, it is difficult to build solid opposing arguments.
The macro context does not help
The total market capitalization of the crypto market has lost 4.53% in the last 24 hours. Bitcoin dominates at 55.59%, a sign that the remaining capital is taking refuge in the sector’s most liquid asset. XRP, which accounts for about 3.16% of the total market cap, is under pressure from a market that is de‑risking. In these contexts, mid‑cap altcoins tend to amplify BTC’s downward moves.
The Fear & Greed Index at 12 — Extreme Fear — completes the picture. It is not a buy signal in itself: the market can remain in extreme fear for weeks during prolonged bear markets. It is rather a reminder that the prevailing sentiment is capitulatory, and that any technical rebound could be followed by further selling from those who were just waiting for a chance to exit.
Bullish scenario: conditions that could change the picture
To talk about a credible recovery of the updated Ripple value, the price should first of all recover and close steadily above 1.20 — that is, the lower daily Bollinger band and the R1 resistance of the daily pivot. An hourly close above that threshold, accompanied by an RSI rising towards 45 and a MACD starting to bend towards zero, would provide the first signs of stabilization.
The first realistic target in a rebound scenario would be the 1.28–1.31 area, where the hourly EMA200 and the daily EMA20 are located, respectively. That is the wall buyers would need to break through to start talking about trend recovery. The scenario is invalidated if the price decisively breaks below 1.13 (daily S1): in that case, room would open towards 1.05–1.00, psychologically relevant zones.
Bearish scenario: the more likely continuation
Given the current context, bearish continuation remains the scenario with the greatest structural consistency. A loss of S1 support at 1.13 with expanding volumes would open the way towards 1.05 and, subsequently, towards the psychological threshold of 1.00 USDT. On a daily basis, there is still no reversal pattern — no relevant reversal candle, no divergence on the RSI, no MACD hook.
This scenario is invalidated if the price closes the daily above 1.24 — the upper hourly Bollinger band — and maintains that position in the following sessions. Only then would it make sense to reconsider the structure in a neutrally bullish light.
How to read this moment from a trading perspective
Anyone looking at the Ripple price today in search of a long entry has to deal with an uncomfortable reality: the RSI in extreme oversold might look like an opportunity, but in a market with rising BTC dominance, fear & greed at 12 and all timeframes aligned to the downside, front‑running a reversal is a high‑risk game. False rebounds in these conditions are frequent and brutal — a 5% green candle can be followed by a new low in the following hours.
Reactive trading — that is, waiting for structural confirmation before acting — is the most defensible approach in this context. Confirmation will not come from a single indicator, but from a convergence: price above 1.20, hourly RSI rising, MACD starting to turn. Until that convergence materializes, the Ripple cost today simply reflects the direction in which the market is looking.


You May Also Like

Palantir Technologies Inc. (PLTR) Stock: Surge as Google Cloud Deal Boosts AI Momentum

Why The Green Bay Packers Must Take The Cleveland Browns Seriously — As Hard As That Might Be

Mutuum Finance (MUTM) Update: V1 Protocol Goes Live, Key Mechanisms Explained


