

Can Bitcoin price break $70,000 resistance as ETF inflows reach a 6-week high?
Bitcoin price briefly touched $70,000 on April 7 within a well-formed ascending channel on the 4H chart, as spot ETF inflows logged $471 million on April 6, the strongest single-day institutional demand figure since late February.
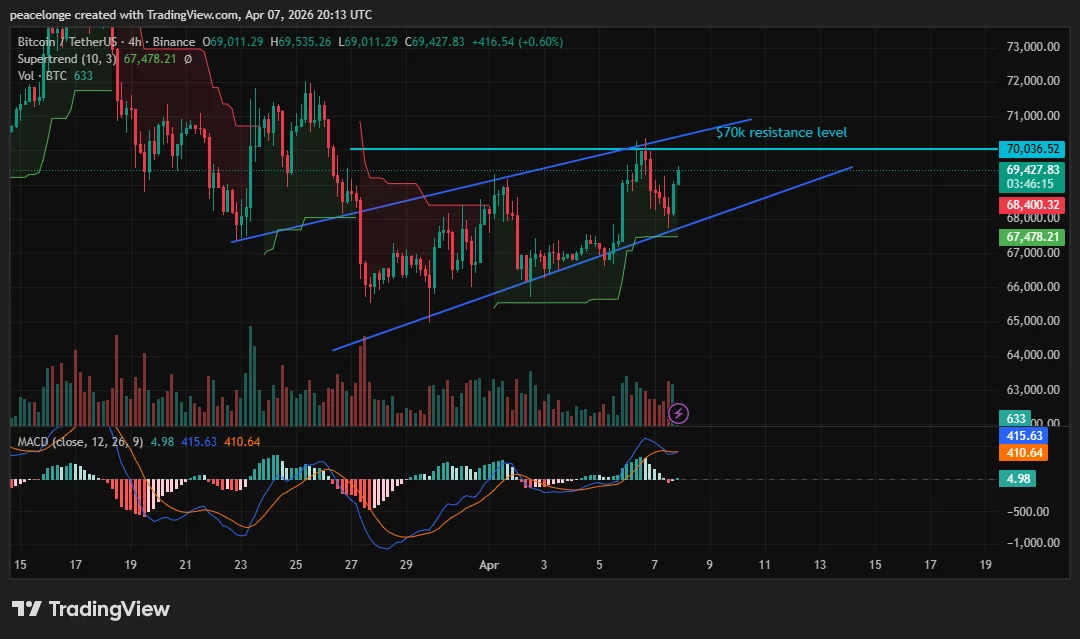
- Bitcoin price reached an intraday high of $70,036 on April 7 before easing to $69,427, pressing the upper boundary of a 4H ascending channel that has held since late March.
- The 4H MACD is printing a bullish cross with the MACD line at 415.63 above the signal at 410.64 and a positive histogram of 4.98, while the Supertrend at $67,478 provides trailing support below price.
- A confirmed 4H close above $70,036 targets $71,000 resistance, while a break below the Supertrend at $67,478 exposes $66,300 as the next structural level.
Bitcoin (BTC) price is trading at $69,427 on April 7, having touched an intraday high of $70,036, the first test of the $70,000 level since March 26. The move came alongside $471 million in spot Bitcoin ETF inflows on April 6, the 6th-largest single-day figure of 2026 per SoSoValue data. The 4H chart shows an ascending channel in place since late March, with price printing consecutive higher lows from the $65,000 zone toward $70,000, but the round-number resistance has capped the advance through multiple sessions.
Ascending Channel and MACD Cross Point Toward Continuation
On the 4H chart, Bitcoin is trading within a defined ascending channel built by two parallel diagonal trendlines. The lower boundary aligns with the Supertrend at $67,478 and has acted as dynamic support throughout the recovery. The upper boundary coincides with the $70,036 resistance annotated on the chart. The 4H MACD is in a confirmed bullish cross, with the MACD line at 415.63 trading above the signal at 410.64 and a positive histogram of 4.98, reflecting building momentum even as price hesitates at resistance.
Analyst Michael van de Poppe of MN Trading Capital wrote on X on April 4 that “the longer the range persists, the heavier the breakout becomes,” adding: “I expect a break above $71,000.” Technical analysis from Investtech published April 7 shows Bitcoin “has given a positive signal from the double bottom formation by a break up through the resistance at $68,120,” with a further rise to $69,769 or more signalled. That target has already been cleared, strengthening the short-term case.
Key Levels: $68,400 Support, $71,000 Bull Target, $67,478 Invalidation
The $68,400 level visible on the 4H chart is the immediate structural support below current price. A close below it exposes the Supertrend at $67,478, which is the invalidation level for the bullish thesis. Investtech identifies $66,300 as the next support below, representing a potential 4.5% decline from current levels in the bear case. On the upside, a confirmed 4H close above $70,036 resolves the current resistance and opens the path to the $71,000 level per van de Poppe’s analysis, with the ascending channel structure remaining intact as long as the Supertrend holds.
ETF Inflows Driving Independent Institutional Demand
Spot Bitcoin ETFs have drawn consistent inflows across recent sessions, with the $471 million on April 6 reflecting renewed institutional appetite at current price levels. According to Binance Research, Bitcoin’s correlation with its Global Easing Breadth Index “turned strongly negative after the launch of spot bitcoin ETFs,” suggesting ETF demand now operates more independently from broader macro conditions. The Iran ceasefire talks on April 6 and 7 provided a short-term macro catalyst, but ETF buyers were already positioned ahead of the move, reinforcing the institutional demand floor near current levels.
If $70,036 continues to hold as resistance, a retest of $68,400 and then the Supertrend at $67,478 becomes the more probable near-term path before any further breakout attempt. A clean 4H close above $70,036 with volume confirmation targets $71,000 as the next resistance.


You May Also Like

HashKey Capital’s Strategic $540K STO Deposit to Binance Reveals Institutional Crypto Moves Amid Market Turmoil


