BTC price outlook: short-term bounce inside a larger downtrend

Bitcoin (BTC) price is trying to stage a short-term recovery around $88,000 after probing below $86,000, but the bigger picture for the BTC price is still a controlled downtrend.
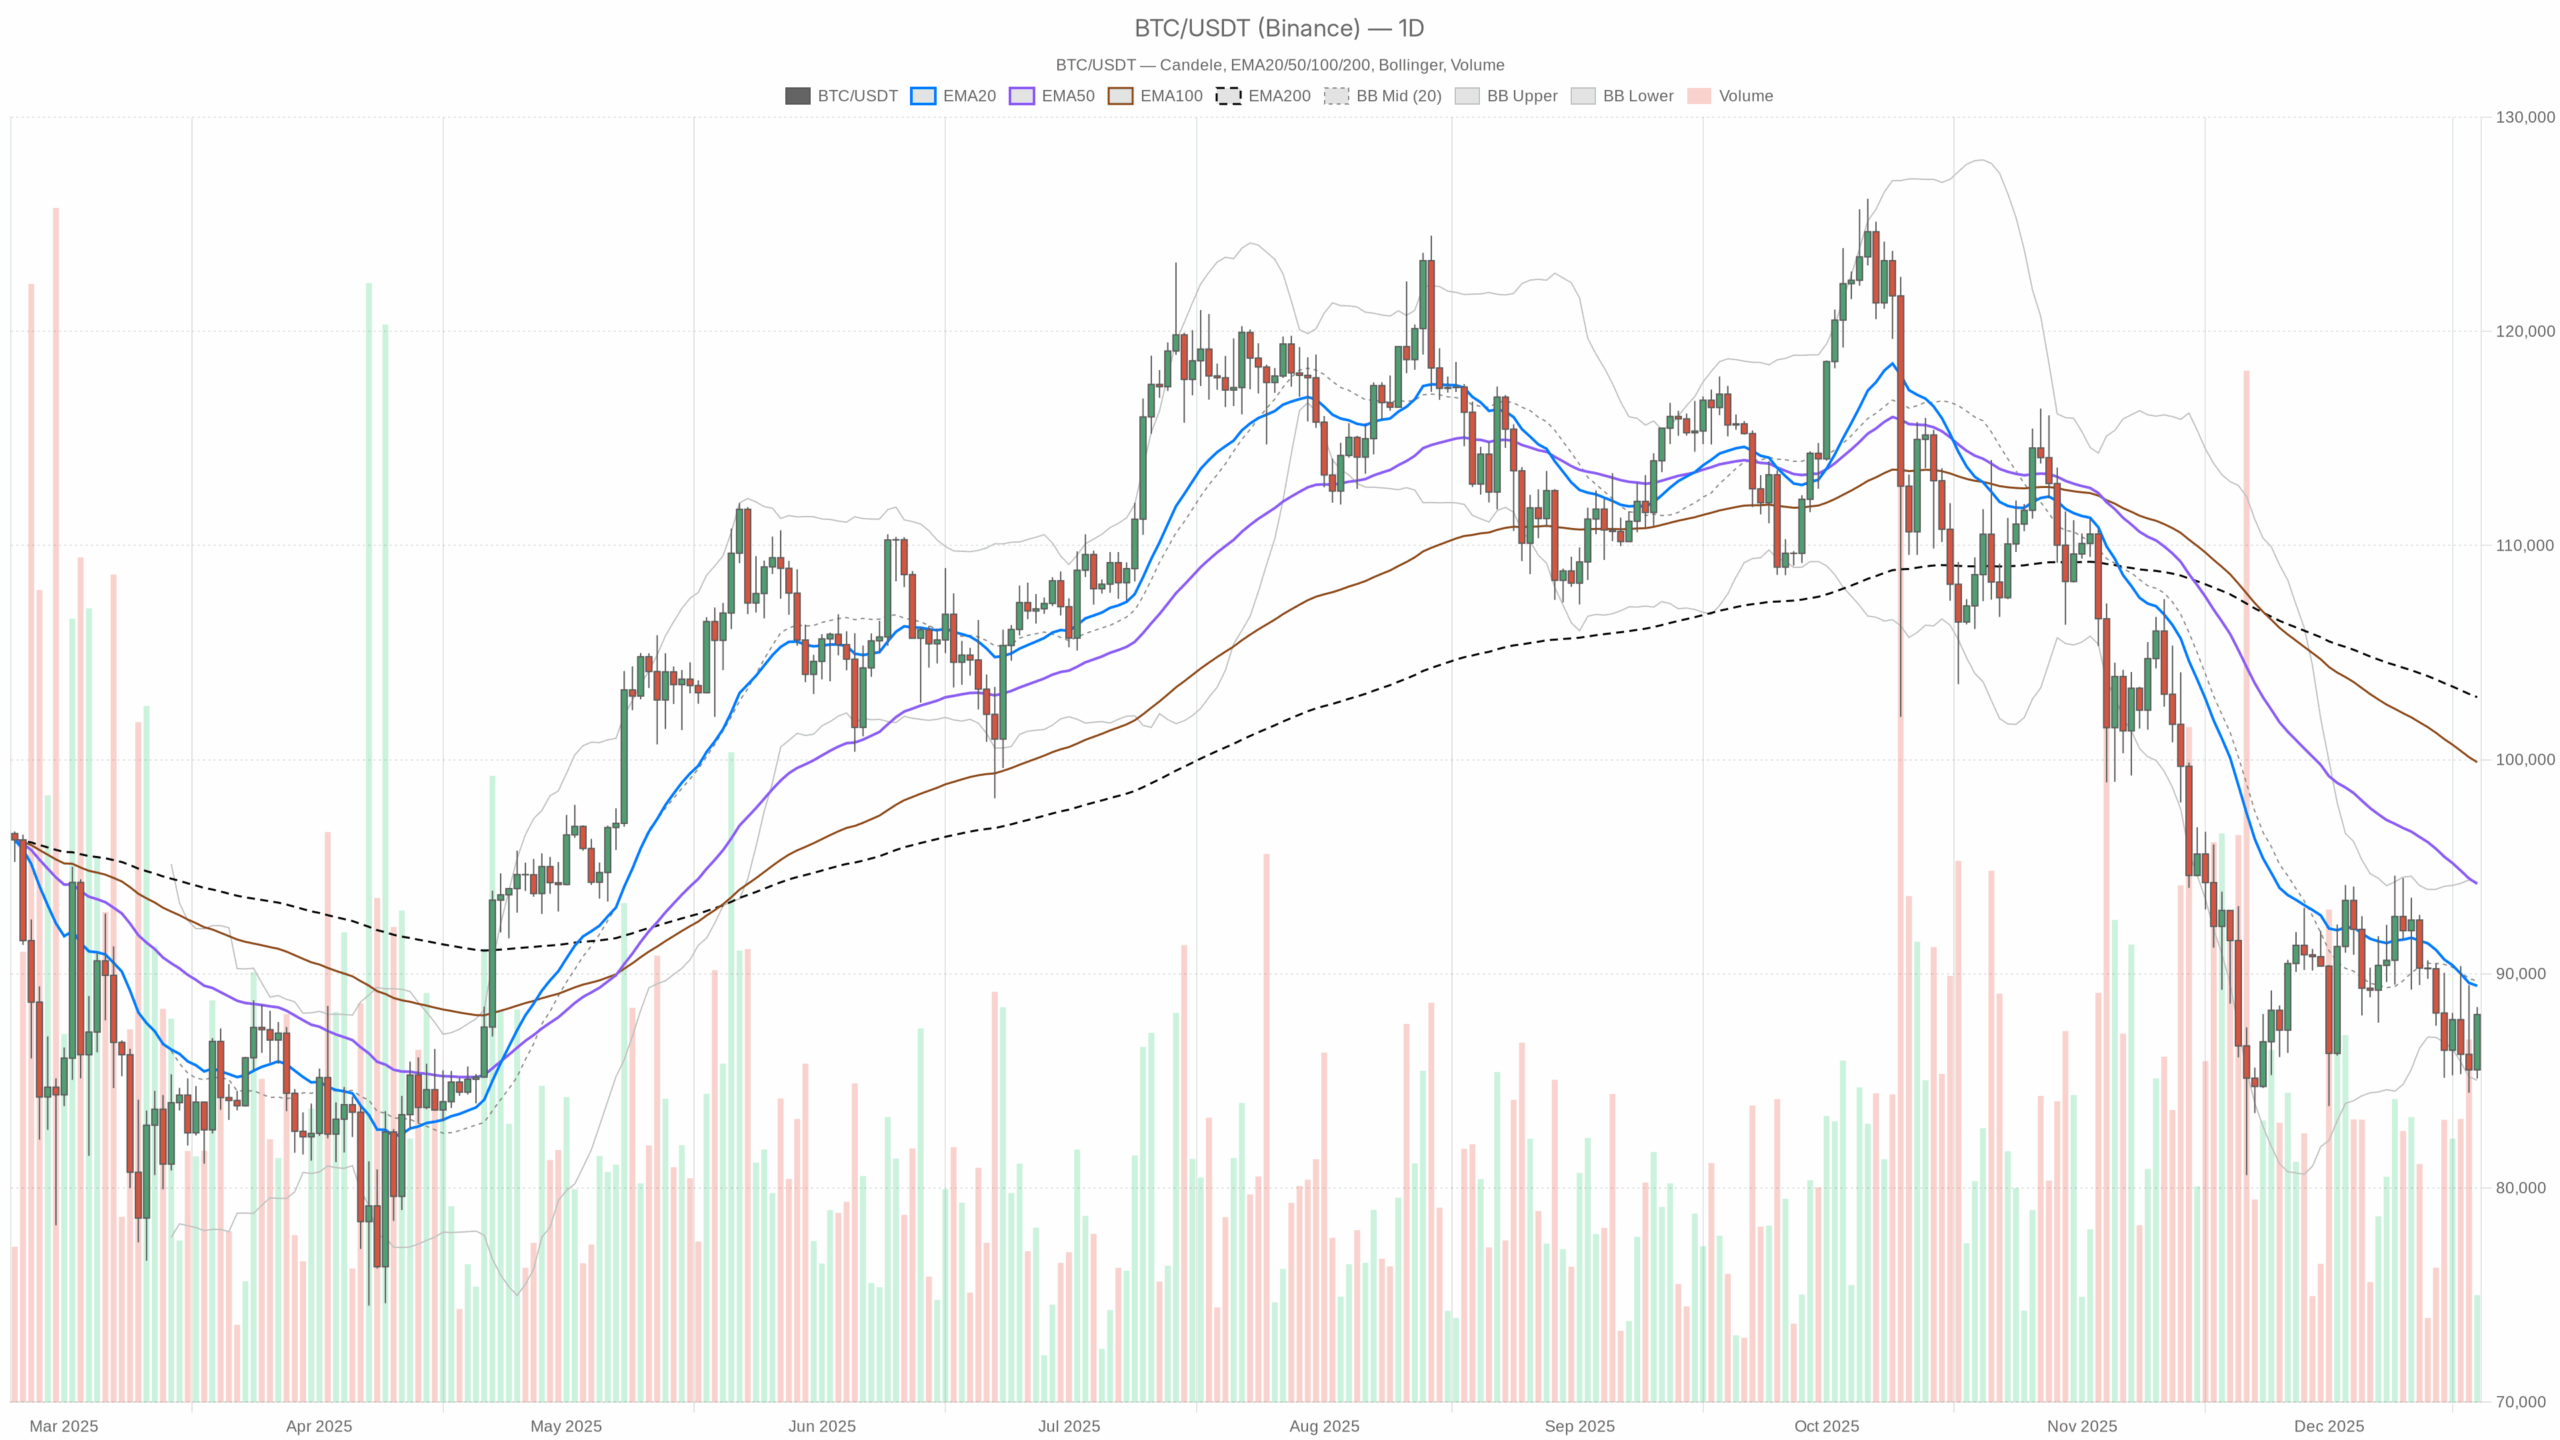 BTC price daily chart with EMA20, EMA50 and volume”
loading=”lazy” />BTC/USDT — daily chart with candlesticks, EMA20/EMA50 and volume.
BTC price Daily chart: primary bias is bearish
This moment matters because fear is extreme (Fear & Greed Index at 16 – “Extreme Fear”) while BTC dominance is still high at around 57.6%. That is classic late-stage selloff behavior: investors are defensive, but they are defending in BTC, not in altcoins.
If this fear phase shifts into forced liquidation, BTC price can accelerate lower. However, if sellers start to exhaust, these are exactly the conditions from which medium-term bottoms often emerge.
The main scenario from the daily timeframe is bearish. BTC is trading below all key moving averages and below the middle of its Bollinger Bands, with momentum still weak. Any long positioning here is, by definition, trading against the dominant daily trend.
Trend structure & EMAs (D1)
- Price: $88,099.99 (daily close)
- EMA 20: $89,437.98
- EMA 50: $94,207.10
- EMA 200: $102,923.10
BTC is trading below the 20, 50, and 200-day EMAs, with the 20 < 50 < 200 and the system labeling the regime as bearish. That is a clean downtrend stack: rallies into the $89k–94k zone are supply areas until proven otherwise.
The distance to the 200-day EMA near $103k underlines how much long-term momentum has already been unwound. This is no longer a shallow pullback but a full cyclical correction.
Momentum: RSI & MACD (D1)
- RSI 14 (daily): 44.27
Daily RSI has climbed back to around 44, up from oversold territory but still below the 50 midline. Sellers are losing some urgency, but buyers have not retaken control.
This is classic “bearish consolidation” momentum: bounces are more about shorts covering than fresh, aggressive buying.
- MACD line: -1,835.78
- Signal line: -1,790.99
- Histogram: -44.79
MACD remains below zero and the line is marginally under the signal, with a slightly negative histogram. Downside momentum is still dominant, but it is not accelerating.
That fits with a market that has already sold off hard and is now in a pause rather than a full reversal higher.
Volatility & Bollinger Bands (D1)
- BB middle band: $89,653.58
- BB upper band: $94,279.07
- BB lower band: $85,028.10
BTC is sitting just above the lower Bollinger Band (~$85k) and below the middle band (~$89.6k). Price hugging the lower half of the bands while volatility remains elevated is textbook downtrend behavior.
However, the fact that price is no longer pinned directly on the lower band hints that the most aggressive part of the sell wave may be behind the market, at least temporarily.
Risk & ATR (D1)
- ATR 14 (daily): $3,476.11
Daily ATR around $3.5k means a +-4% swing in a single day is perfectly normal right now. This is elevated but not panic level for BTC.
Risk is high enough that chasing moves without a plan can be painful, but it is not so extreme that the market is in a full volatility blow-off.
Daily pivots (D1)
- Pivot point (PP): $87,219.76
- Resistance R1: $89,329.29
- Support S1: $85,990.47
BTC closed just above the daily pivot at $87.2k and below R1 at $89.3k. That is a mildly constructive intraday close, but still inside a clear bearish macro structure.
As long as price is trapped between the pivot and R1, the market is simply ranging inside a larger downtrend. A clean push through R1 with follow-through would be the first sign that the bounce has real legs.
Hourly chart: short-term bounce challenging resistance
The 1-hour chart shows a very different story from the daily. Here, BTC is in a short-term recovery, attempting to turn $88k from resistance into support. This is where the bull and bear tension shows up.
Trend structure & EMAs (H1)
- Price: $88,131.66
- EMA 20: $86,783.74
- EMA 50: $86,821.53
- EMA 200: $88,195.16
On the hourly, price is trading above the 20 and 50 EMA but is basically clamped under the 200 EMA around $88.2k, with the regime flagged as neutral. Intraday traders are clearly trying to drive a bounce, but the 200-hour EMA is acting as a ceiling.
The short-term trend is up, but it is running straight into medium-term resistance.
Momentum: RSI & MACD (H1)
- RSI 14 (hourly): 62.94
Hourly RSI near 63 shows a solid bullish impulse on this timeframe. The market has shifted from oversold to mildly overbought intraday.
That is good for the bounce, but it also means fuel is starting to run low for fresh longs unless higher timeframes start to confirm.
- MACD line: 204.69
- Signal line: -67.69
- Histogram: 272.38
Hourly MACD is firmly positive with a strong positive histogram. Short-term momentum is clearly with the bulls.
This is the classic “countertrend squeeze” look: shorts are being pressured as price grinds up into key resistance levels.
Volatility & Bollinger Bands (H1)
- BB middle band: $86,662.32
- BB upper band: $89,305.64
- BB lower band: $84,019.01
BTC is riding in the upper half of the hourly bands, closer to the upper band near $89.3k. That confirms a short-term upmove, but also says the easy part of the squeeze may be behind traders.
Pushing through the upper band often requires fresh catalysts, not just short covering.
Risk & ATR (H1)
- ATR 14 (hourly): $788.42
Hourly ATR around $800 means 1–2% swings per hour are entirely normal right now. For traders, that is ample room for both profits and traps, especially around the 200-hour EMA and the daily pivot confluence.
Hourly pivots (H1)
- Pivot point (PP): $88,017.20
- Resistance R1: $88,291.79
- Support S1: $87,857.06
BTC is hovering around the hourly pivot at $88k and testing R1 at $88.29k. As long as price holds above the pivot, intraday traders will keep leaning bullish.
A clean failure back below $87.85k (S1) would tell you the bounce is losing steam.
15-minute chart: execution zone, not a trend signal
The 15-minute chart is bullish, but this should be read as execution context rather than a directional macro signal.
Trend structure & EMAs (M15)
- Price: $88,122.22
- EMA 20: $87,412.94
- EMA 50: $86,853.81
- EMA 200: $86,696.06
On M15, price is comfortably above all three EMAs, and the regime is marked as bullish. Very short term, the path of least resistance is still up.
This is exactly how countertrend bounces often look right before they either extend into a proper reversal or abruptly roll over once the higher timeframes reassert themselves.
Momentum: RSI & MACD (M15)
- RSI 14 (15-min): 66.95
RSI near 67 on the 15-minute chart shows local overbought conditions. There is still room for a last push, but you do not want to confuse this with a fresh, low-risk entry point.
It is much closer to the “late” part of this intraday leg.
- MACD line: 465.21
- Signal line: 442.85
- Histogram: 22.36
MACD is positive but the histogram is small. Bulls still control the tape on this tiny timeframe, but momentum is no longer accelerating. It is more of a mature push than the start of a new leg.
Volatility, Bands & pivots (M15)
- BB middle band: $87,428.05
- BB upper band: $88,342.52
- BB lower band: $86,513.57
- ATR 14 (15-min): $332.48
- Pivot point (PP): $88,072.03
- Resistance R1: $88,213.31
- Support S1: $87,980.93
Price is oscillating just above the 15-minute pivot and close to R1, near the upper Bollinger Band. That is typical of a short-term grind higher that is starting to run into resistance clusters.
For active traders, this is more a zone to manage risk tightly than to initiate new, aggressive positions in either direction.
Sentiment & macro context for BTC price
Beyond the chart, market data show a crypto total market cap around $3.05 trillion, up about 1.27% in the last 24h, with BTC dominance near 57.6%. Capital is concentrated in BTC, which often happens in late-cycle risk-off phases.
Investors keep exposure, but only in the “safer” end of crypto. The Fear & Greed Index printing Extreme Fear (16) tells you positioning is already defensive.
Add in recent headlines about Bitcoin “heading for a fourth annual loss” and “volume slumps,” and you can see why sentiment is washed out. Historically, this type of backdrop can precede both sharp capitulation spikes lower and powerful mean-reversion rallies. Timing is the hard part.
BTC price scenarios
Bullish scenario (countertrend rebound)
For the bulls, the play here is a continuation of the short-term squeeze into a deeper retracement of the downtrend. The focus is on whether this countertrend move can extend.
What bulls want to see next:
- On the hourly, a decisive break and hold above the 200-hour EMA (~$88.2k) and hourly R1, turning $88k into a solid intraday support zone.
- On the daily, a push through the daily pivot ($87.2k) with a daily close above R1 ($89.3k) and the 20-day EMA (~$89.4k). That would be the first real sign that the downtrend is transitioning into a broader range rather than a straight slide.
- RSI on daily moving back toward or above 50, and MACD histogram shrinking toward zero, signaling that downside momentum is finally being neutralized.
If this plays out, the rebound could target the mid-$90k area (upper daily Bollinger Band and 50-day EMA near $94k) as a logical medium-term upside magnet. That would still be a bear-market rally until the 200-day EMA near $103k is reclaimed, but it can be a sizable move.
What invalidates the bullish scenario?
A clean rejection from the $89k–90k zone, especially if BTC fails to close a day above the 20-day EMA and drops back below the daily pivot ($87.2k), would undercut the bullish case. A break and daily close back under S1 ($85,990) would strongly suggest the bounce was just a pause before another leg down.
Bearish scenario (trend continuation)
The dominant daily trend is still down, so the bearish scenario has structural backing. Bears want any bounce to fail into lower highs that confirm trend continuation.
What bears want to see next:
- Intraday bounces failing at the 200-hour EMA (~$88.2k) and the daily 20-EMA/BB mid band zone around $89k–90k, creating a lower high relative to previous swing levels.
- Hourly and 15-minute RSI rolling over from overbought levels, with MACD crossing back down and price slipping below the hourly pivot (~$88k) and then the daily pivot ($87.2k).
- A decisive break below daily S1 ($85,990), opening the way for a test of, and potential close beneath, the lower daily Bollinger Band (~$85k).
In that case, BTC would remain in a clean downtrend, and the market could start probing for a more durable bottom below current levels. With ATR near $3.5k, a typical extension could put spikes into the low-$80k or even high-$70k region before real structural buying appears.
What invalidates the bearish scenario?
The bear case weakens significantly if BTC can reclaim and hold above the 20-day EMA (~$89.4k) and start closing daily candles above $90k. A rising daily RSI through 50 and a MACD cross back toward neutral would confirm that sellers have lost the upper hand.
A reclaim of the 50-day EMA (~$94k) would force any structurally bearish view back into neutral.
Positioning, risk and uncertainty
Right now, the BTC price is caught between a short-term bullish squeeze and a dominant daily downtrend. The cleanest way to think about it is to separate timeframes clearly.
- Daily: trend is down, rallies into $89k–94k are potential selling zones unless proven otherwise.
- Hourly/15m: trend is up, providing tactical opportunities for both bounce traders and patient bears looking for better entry levels.
Volatility is elevated but not extreme, and sentiment is deeply fearful. That combination often creates sharp, two-sided price action: violent squeezes higher inside a broader grind lower. Anyone trading this tape needs to anchor decisions to timeframe.
Short-term signals can flip in hours, while the daily downtrend will only change with several days of sustained strength. This is not a market phase where aggressive conviction pays off for most participants.
It is a phase where respecting levels, especially the daily pivot and the $89k–94k resistance band, and managing risk size matters more than having a strong opinion on where BTC should trade next.
Open your Investing.com account
This section contains a sponsored affiliate link. We may earn a commission at no additional cost to you.
Disclaimer: This analysis is for informational and educational purposes only and does not constitute investment, trading, or financial advice. Cryptocurrency markets are highly volatile and involve substantial risk, including the risk of total loss. Always conduct your own research and consider your risk tolerance before making any trading decisions.
You May Also Like

The Old Bitcoin Rules No Longer Apply, Arthur Hayes Warns

Is A $10,000 Ethereum Price Within Reach? Here’s What Experts Are Forecasting Next