

Alphabet Stock Slides on $84.75 Billion Dilution Shock

Alphabet stock faces a sharp near-term correction due to a strategic $84.75 billion equity offering, triggering immediate selling pressure despite the long-term growth narrative tied to AI infrastructure expansion.
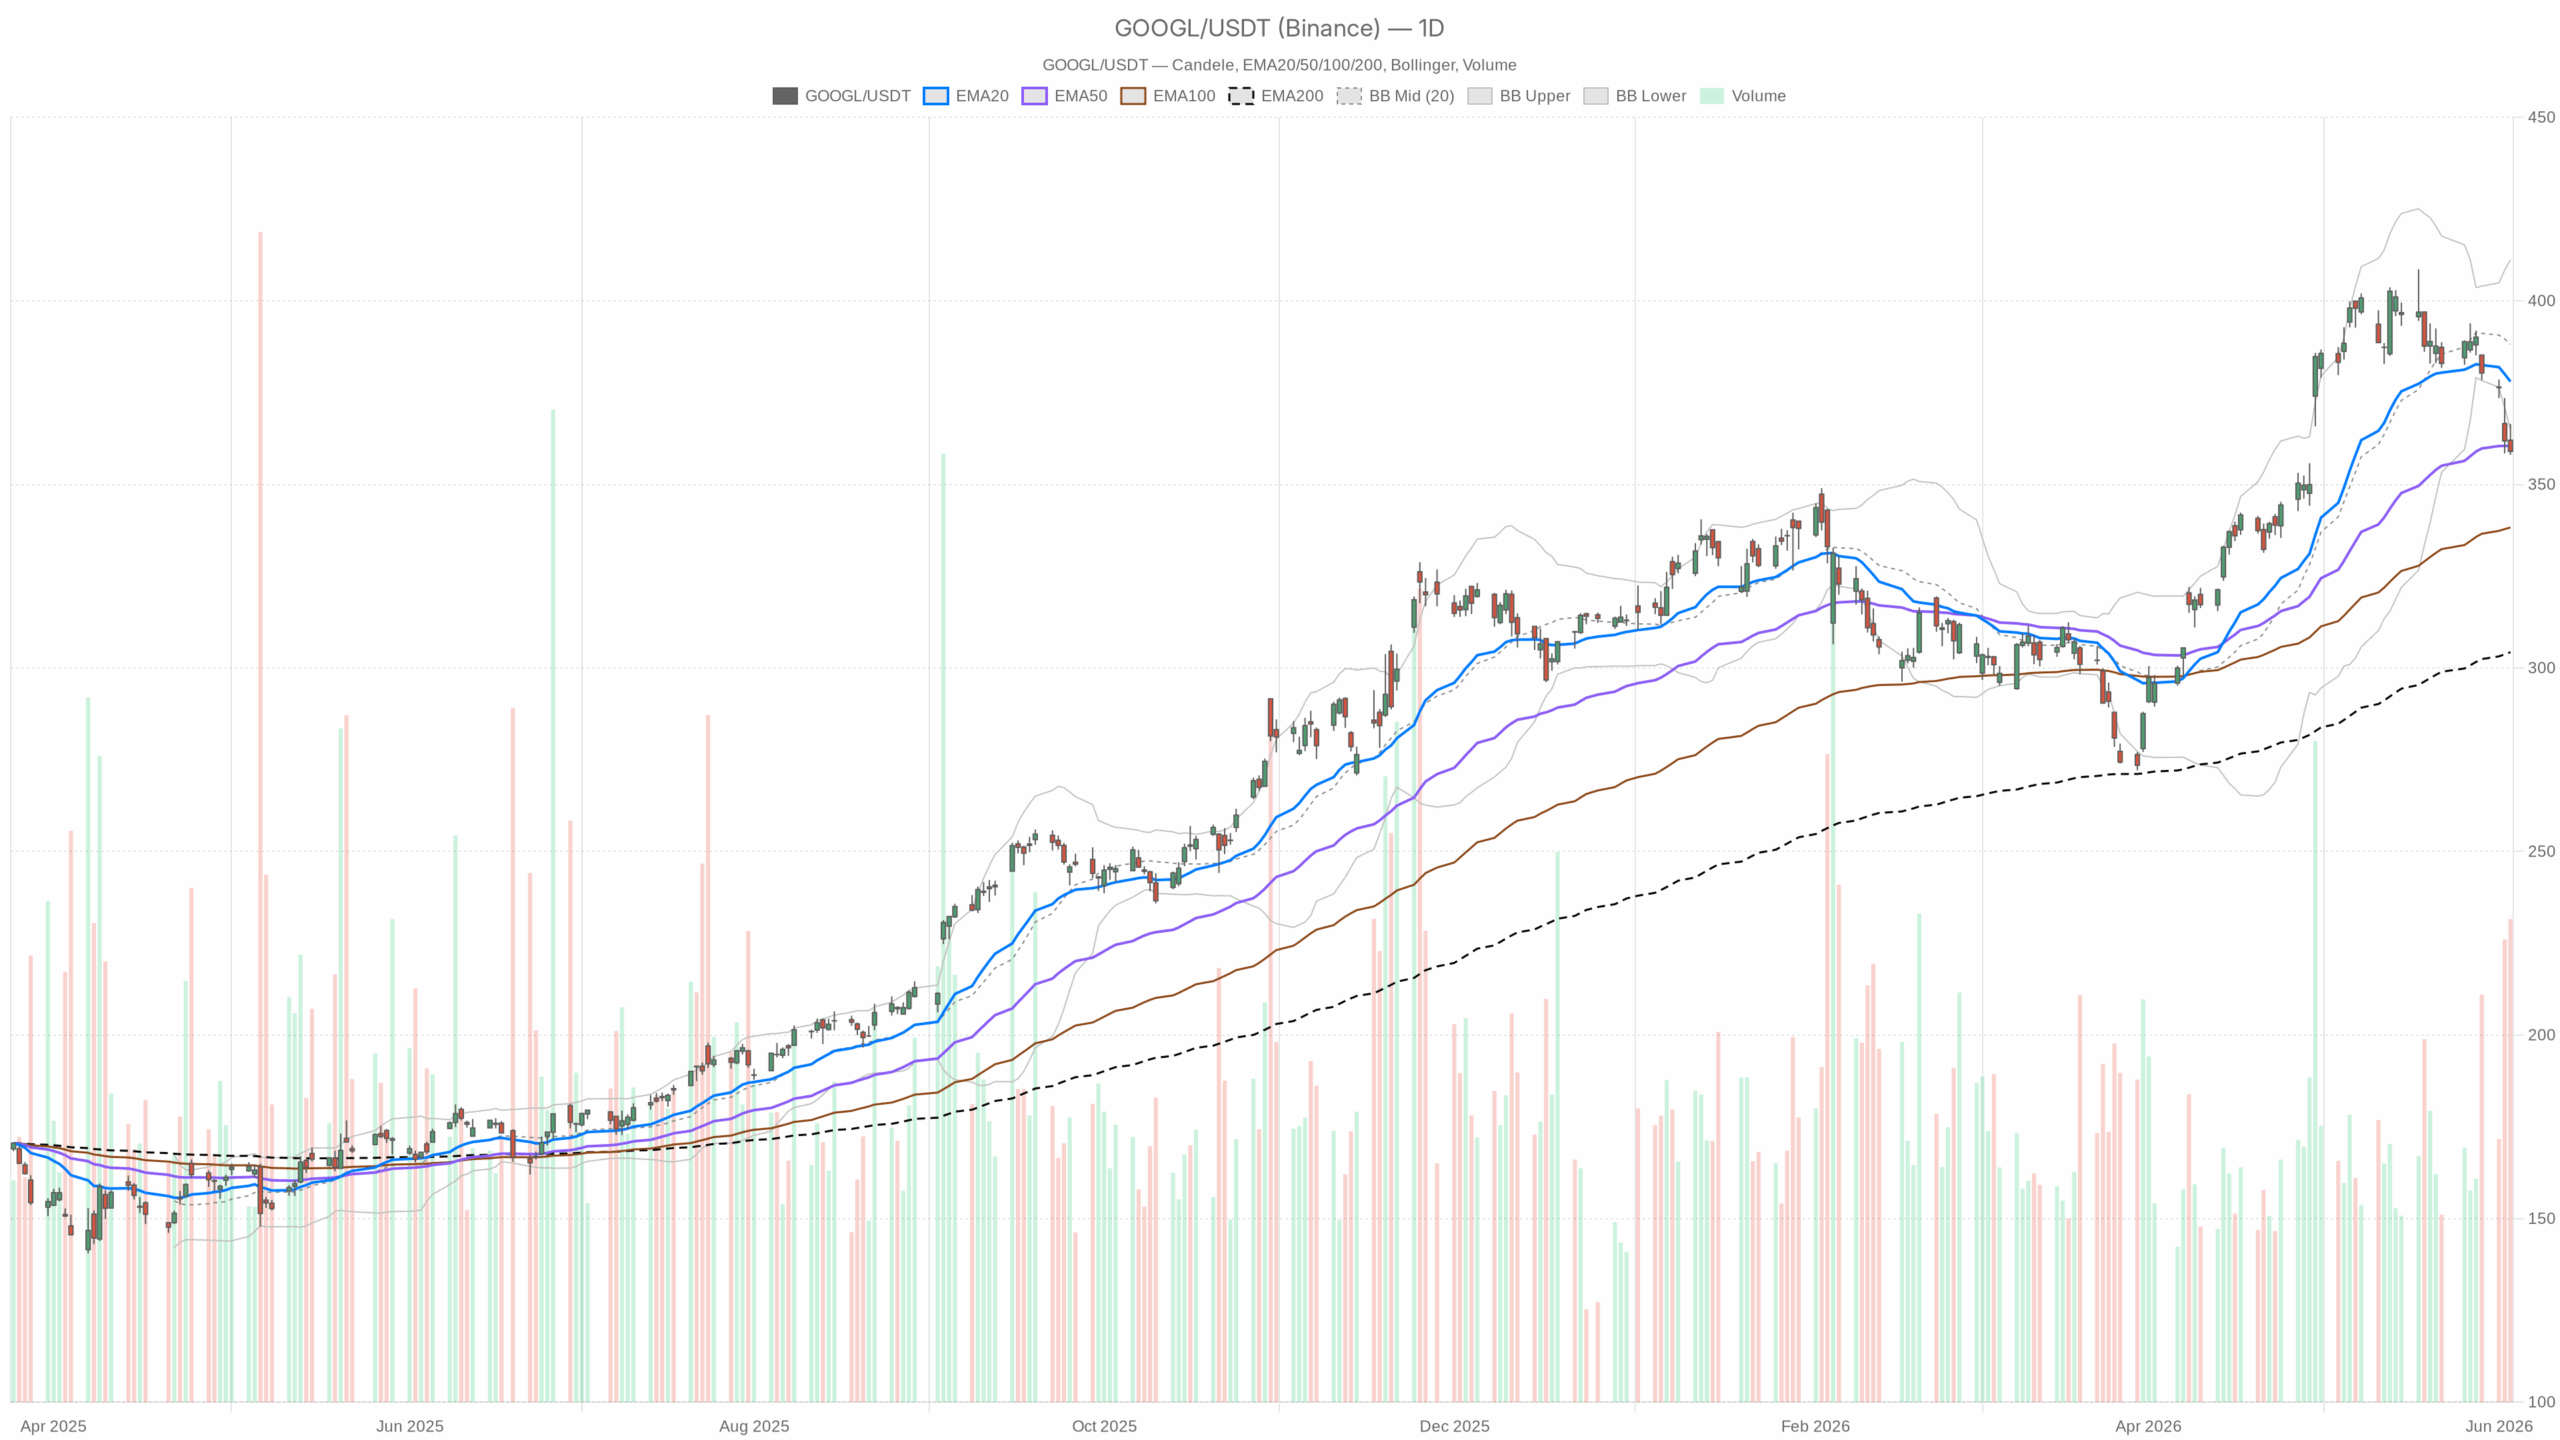 GOOGL — daily chart with candlesticks, EMA20/EMA50 and volume.
Alphabet Stock Faces Selling Pressure Amid Equity Offering Announcement
The company’s largest equity raise combines multiple share classes and a $40 billion at-the-market program, fueling market concerns about dilution. Though intended to fund AI infrastructure, the initial reaction centers on the share dilution impact rather than fundamentals.
Technical Outlook Reveals Near-Term Weakness in GOOGL Shares
Daily Chart Shows Structural Stress at EMA50 Level
Alphabet stock closed at $358.99 on June 3, trading below its 20-day EMA at $378.02 and just above the critical 50-day EMA at $360.44. The EMA50 now serves as a pivotal support level; a decisive close below it would mark a structural breakdown. Meanwhile, the 200-day EMA at $304.29 remains well below price, indicating no breach of the broader uptrend despite near-term deterioration.
Bearish Momentum Dominates Daily Indicators
The MACD histogram at -6.19 reflects accelerating downside momentum, with the RSI nearing oversold territory at 38.82 but still allowing room for further declines. The price has fallen below the lower Bollinger Band at $365.08, signaling active distribution rather than routine consolidation. Elevated daily ATR of 9.55 confirms heightened volatility, while the daily pivot point at $361.17 frames resistance and support at $364.27 and $355.90, respectively. Current trading between the pivot and S1 places pressure on the tape.
Hourly Chart Highlights Momentum Flush, Signs of Intraday Exhaustion
The H1 RSI at 23.21 indicates deep oversold conditions intraday, while all hourly EMAs (20, 50, 200) hover well above price, confirming a fully inverted short-term trend. The MACD on the hourly chart shows contraction, with a nearly flat histogram at -0.19, suggesting selling momentum is waning. This does not confirm a reversal but raises the likelihood of near-term technical stabilization.
Short-Term Price Action Suggests Possible Base Formation
At the 15-minute level, the MACD histogram has turned positive (+0.19) and RSI rebounded to 39.11 from oversold levels. The tightening Bollinger Bands indicate a price squeeze near $358–$359. Despite these signs, the short-term EMA stack remains above price, implying any bounce will likely be countertrend and should be treated cautiously.
Fundamental Context: Strategic AI Investment Versus Dilution Concerns
Alphabet aims to leverage the equity raise to expand AI infrastructure amid intensifying competition. Institutional demand for the offering was strong enough to justify its upsizing, supporting a bullish narrative of long-term transformation. Conversely, UBS’s rating stance highlights immediate cloud margin pressures and dilution risks, which challenge near-term valuation multiples.
Potential Scenarios for Alphabet Stock Going Forward
Bullish Scenario: Stabilization Above Support Zone
If GOOGL can hold the $355–$358 support range and recover past the EMA50 and pivot levels, buyers may return. This could enable a move toward the $388 midline of the Bollinger Band. The extreme hourly RSI supports a possible mean reversion, although this depends on easing cloud margin concerns and gaining traction in the AI narrative.
Bearish Scenario: Breakdown Below Key Support
A decisive daily close below $355.90 and failure to hold EMA50 could open the door to a drop toward the $340s. Continuing negative MACD divergence and margin pressure would suggest further downside. The stock may remain under sustained selling pressure as the market weighs dilution impacts ahead of any profit margin expansion.
Conclusion: Alphabet Stock Navigates Near-Term Stress Amid Strategic Shift
Overall, the technical and fundamental evidence points to significant short-term pressure on Alphabet stock. The daily and hourly charts indicate defensive bias and momentum exhaustion, respectively, while early 15-minute signals hint at tentative stabilization. Traders should approach any rebounds cautiously until consistent gains above EMA50 confirm strength. Meanwhile, long-term investors may see the capital raise as a strategic step toward AI leadership. Market reaction to dilution and cloud margin guidance will likely shape the stock’s next direction amid elevated volatility.


You May Also Like

Palantir Technologies Inc. (PLTR) Stock: Surge as Google Cloud Deal Boosts AI Momentum
Nedbank taps AI-powered lending to reach underserved South Africans
Integra and SettleMint Join Forces for Real Estate Tokenization


