Bitcoin Found Support Where Recent Buyers Can’t Afford to Lose: Discover the Mechanics
Bitcoin is trading above $80,000 as the market prepares for what is shaping up to be a decisive directional move. The recovery from the recent correction has been meaningful — but a CryptoQuant report has identified the specific mechanism that prevented the decline from becoming considerably worse, and understanding it changes how the current price level should be read.
The report examines the realized prices of different whale cohorts — the average cost basis of large Bitcoin holders segmented by how recently they have been active. When the spot price falls toward a whale cohort’s realized price, it approaches the level at which those holders would begin taking losses if they sold. That proximity to breakeven creates a natural support mechanism: large holders become increasingly reluctant to sell as they approach their cost basis, which reduces selling pressure precisely where the market needs it most.
During the recent correction, two specific cohorts provided that support. Whales active within the last one to seven days held a realized price of approximately $66,000. Whales active within the last seven to thirty days held a realized price of approximately $70,600. The spot price dropped toward both of those levels during the correction — and rather than breaking through them into deeper losses for those holders, the price found support and reversed.
The $66,000 to $70,600 range was not a random bounce zone. It was where billions of dollars in recent whale capital reached its breakeven — and where the behavioral dynamics of large holders created the floor that held.
The Floor Held. But It Only Holds Until It Doesn’t
The CryptoQuant report explains why the $66,000 to $70,600 range produced the price reaction it did. When Bitcoin’s spot price approaches the realized price of a major whale cohort, the selling dynamics change fundamentally. These are not participants who bought Bitcoin speculatively and will sell at the first sign of stress — they are large, recent buyers whose cost basis sits within the zone.

The same zone that discourages selling also attracts buying. A price level where informed, recent capital bought Bitcoin and where those holders are defending their positions becomes a natural re-accumulation area — one where the buyers who were correct the first time tend to add rather than exit.
The positive price reaction from the support range confirms that the zone performed its structural function. Bitcoin tested the breakeven levels of its most recently active large holders and bounced. A reaction that reflects genuine demand meeting reduced selling pressure in a specific, explainable price range.
The CryptoQuant assessment of what comes next is honest in both directions. As long as Bitcoin remains above the $66,000 to $70,600 zone, the evidence supports the formation of a local bottom and the beginning of the next directional move. The recovery above $80,000 is consistent with that reading.
The risk the report preserves is equally specific. A decisive breakdown below the lower boundary of the support zone — below $66,000 — would invalidate the bottom thesis entirely and represent a strong bearish signal for the broader market. The floor held. Whether it continues to hold defines everything that follows.
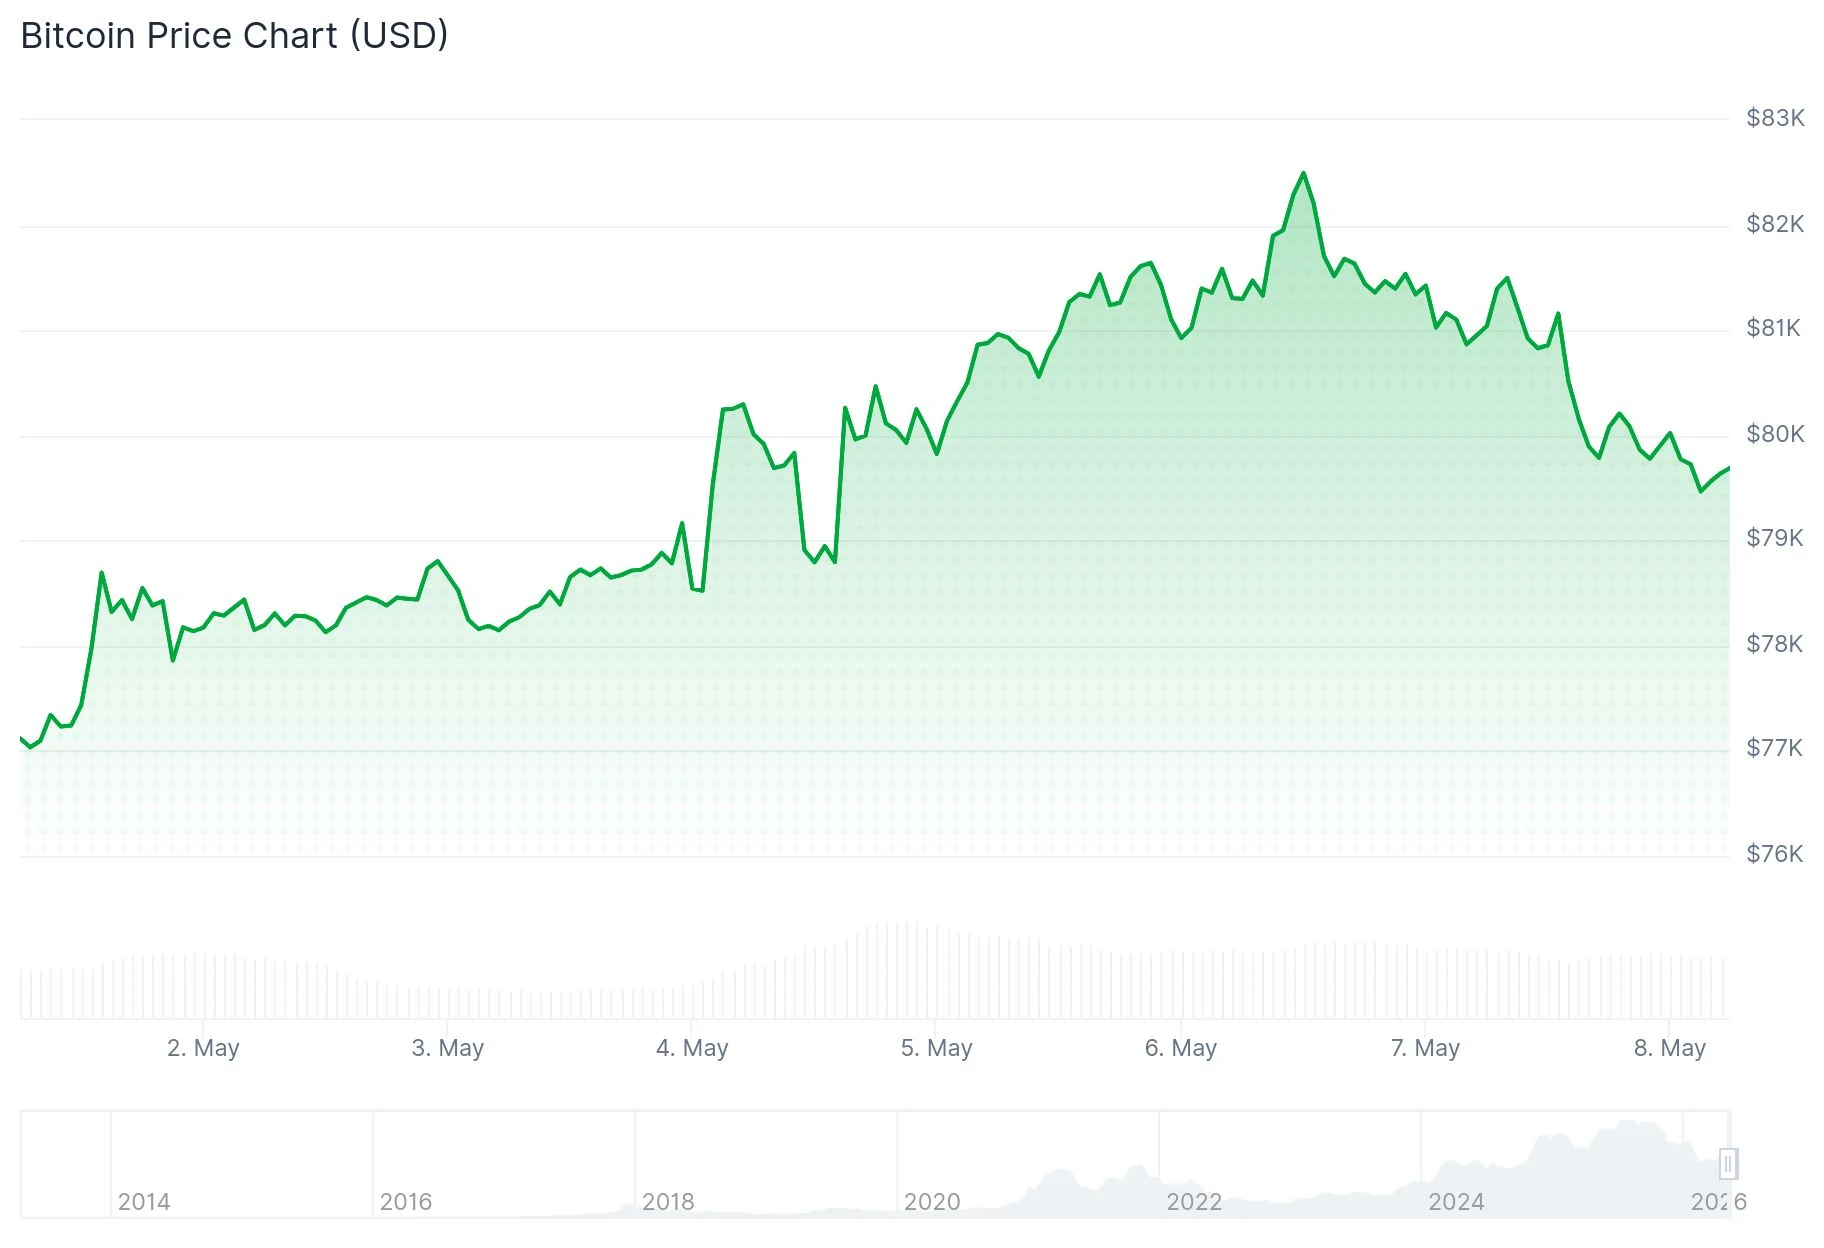
Bitcoin Tests Resistance After Structured Recovery From February LowsBitcoin is trading near $80,700 on the daily chart, pressing directly into a resistance zone that has rejected price multiple times since the breakdown earlier this year. The recovery from the February low near $60,000 has been technically clean, with price forming a sequence of higher lows and reclaiming the 50-day and 100-day moving averages along the way. That shift confirms a transition from a corrective phase into a developing uptrend.

However, the current test is not occurring in a vacuum. The 200-day moving average is still trending downward and sits just above price, acting as dynamic resistance near the $82,000 region. This confluence — horizontal resistance plus a declining long-term average — explains why momentum has slowed as Bitcoin approaches this level.
Volume has remained moderate during the latest push higher, which suggests the move is being driven more by controlled demand than aggressive breakout participation. This creates a fragile setup: structurally bullish, but not yet confirmed.
If Bitcoin breaks and holds above $82,000, it would mark a decisive shift in market structure and likely trigger continuation. Failure here would expose the $74,000–$76,000 region as the first support, with deeper demand sitting closer to $70,000.
Featured image from ChatGPT, chart from TradingView.com


You May Also Like
Bitcoin (BTC) Slips Under $80K: Critical Support Zones After $82.8K Rejection

US Nonfarm Payrolls Expected to Rise by 62K in April: Labor Market Shows Resilience