


What NVDA and AMD actually sell: product stack and business model
NVIDIA: GPUs + networking + software platforms
AMD: CPUs + GPUs + adaptive computing
- Data Center: EPYC server CPUs and Instinct accelerators (plus supporting products)
- Client: Ryzen PC CPUs/APUs
- Gaming: console SoCs and Radeon graphics
- Embedded/Adaptive: FPGA and embedded silicon (post-Xilinx era)
Common ground: why NVDA and AMD often move together
- They’re cyclical. Semiconductor demand is tied to data center spending, PC refresh cycles, and consumer electronics cycles.
- They’re capex-sensitive. Big buyers (hyperscalers and enterprises) can shift budgets quickly, especially in AI infrastructure cycles.
- They’re “risk-on Nasdaq” exposures. When rates, liquidity, or tech sentiment swings, both can re-rate sharply.
- They compete in overlapping arenas. Data center acceleration and AI inference/training are strategic battlegrounds for both.
Price history: year-end closes show different eras of dominance
Year | NVDA (year-end close, adj.) | AMD (year-end close, adj.) |
2016 | 2.63 | 11.34 |
2017 | 4.79 | 10.28 |
2018 | 3.31 | 18.46 |
2019 | 5.86 | 45.86 |
2020 | 13.02 | 91.71 |
2021 | 29.36 | 143.9 |
2022 | 14.6 | 64.77 |
2023 | 49.51 | 147.41 |
2024 | 134.29 | 120.79 |
2025 | 186.5 | 214.16 |
- NVDA’s “step-change” shows up most dramatically from 2023–2025, reflecting how the market priced NVIDIA as the prime beneficiary of AI infrastructure demand.
- AMD’s path shows powerful rallies (notably 2016, 2019–2021, 2023, 2025) but also sharper periods of digestion when the market reset expectations on PC demand, gaming, or competitive dynamics.
Dividends: NVDA pays (small); AMD does not
Year | NVDA dividend/share (USD) | AMD dividend/share (USD) |
2016 | 0.0121 | 0 |
2017 | 0.0143 | 0 |
2018 | 0.0153 | 0 |
2019 | 0.016 | 0 |
2020 | 0.016 | 0 |
2021 | 0.016 | 0 |
2022 | 0.016 | 0 |
2023 | 0.016 | 0 |
2024 | 0.034 | 0 |
2025 | 0.04 | 0 |
Total returns: the decade where compounding separated the two
Year | NVDA total return | AMD total return |
2016 | +226.95% | +295.12% |
2017 | +81.99% | −9.35% |
2018 | −30.82% | +79.57% |
2019 | +76.94% | +148.43% |
2020 | +122.3% | +99.98% |
2021 | +125.48% | +56.91% |
2022 | −50.26% | −54.99% |
2023 | +239.02% | +127.59% |
2024 | +171.25% | −18.06% |
2025 | +38.92% | +77.3% |
- Both names can deliver “venture-style” equity outcomes in strong cycles (2016, 2019–2021, 2023).
- NVDA’s 2023–2024 performance was extraordinary, reflecting the market’s view of NVIDIA’s AI platform dominance.
- AMD can still outperform in specific years (e.g., 2016 and 2025 here), but it has historically required the market to believe in sustained share gains plus a favorable demand cycle.
Why the market pays different multiples: the “moat shape” matters
NVIDIA’s moat: software lock-in + system-level pricing power
AMD’s moat: credible second source + broad compute portfolio
Risk checklist: what can break the thesis for each
- AI capex normalization: If hyperscaler spending slows, both can re-rate lower.
- Export controls / geopolitics: Restrictions can hit volumes and mix.
- Inventory cycles: Semis routinely overshoot and correct.
- Competition: From each other, plus Intel and custom silicon from cloud providers.
- Concentration risk in AI accelerators: if an alternative stack gains meaningful traction, NVDA’s platform premium could compress.
- Execution risk in accelerators: AMD must prove sustained competitiveness and scale in AI accelerators to narrow the perception gap vs NVIDIA’s ecosystem.
How this comparison is used in real work
- Earnings prep: build a simple scorecard (data center growth, gross margin, product roadmap, customer concentration).
- Scenario analysis: estimate what happens if AI infrastructure spend slows, or if AMD gains a defined share of accelerator deployments.
- Portfolio construction: decide whether you want a single “category winner” exposure (more NVDA-like) or a diversified challenger exposure (more AMD-like), then size positions based on volatility and drawdown tolerance.
Tokenized U.S. stocks on MEXC: NVDAON and AMDON (and how they differ from shares)
- Shareholder rights: Tokenized products may not provide voting rights and may not mirror dividend entitlement the way direct share ownership does (design varies).
- Trading hours/rails: Tokenized products may trade with crypto-style market structure, potentially offering different access windows than the Nasdaq cash equity market.
- Product risk stack: Beyond price risk, you may have additional risks tied to token structure, custody/issuer design, and platform-specific rules.
Bottom line: the same “AI wave,” but different ways to win
- NVDA stock has been priced as the primary “AI infrastructure platform,” reinforced by data center dominance and an ecosystem moat that can translate to platform-style economics.
- AMD stock is the multi-category challenger with a wide compute portfolio and clear upside when it executes, gains share, and rides favorable demand cycles—especially as customers diversify suppliers.
Description:Crypto Pulse is powered by AI and public sources to bring you the hottest token trends instantly. For expert insights and in-depth analysis, visit MEXC Learn.
The articles shared on this page are sourced from public platforms and are provided for reference only. They do not represent the position or views of MEXC. All rights belong to MEXC. If you believe any content infringes upon the rights of a third party, please contact [email protected] for prompt removal. MEXC does not guarantee the accuracy, completeness, or timeliness of any content and is not responsible for any actions taken based on the information provided. The content does not constitute financial, legal, or other professional advice, nor should it be interpreted as a recommendation or endorsement by MEXC. For expert insights and in-depth analysis, visit MEXC Learn.
Learn More About Gensyn
View More
Zero Threshold, Zero Slippage: How to Trade U.S. Stock Futures on MEXC
CXMT (688825.SH) Stock: China’s DRAM Champion Surges in Shanghai Debut
MEXC On-chain Daily Report: Hyperliquid RWA weekly trading volume exceeds half for the first time
Latest Updates on Gensyn
View More
Daily Market Update: Nasdaq Gains 1.3% and Bitcoin Recovers as AI Chip Demand Grows

KlariVis Names Marcos Souza Chief Data & Analytics Officer, Elevates Guy DeCorte to Chief AI Officer
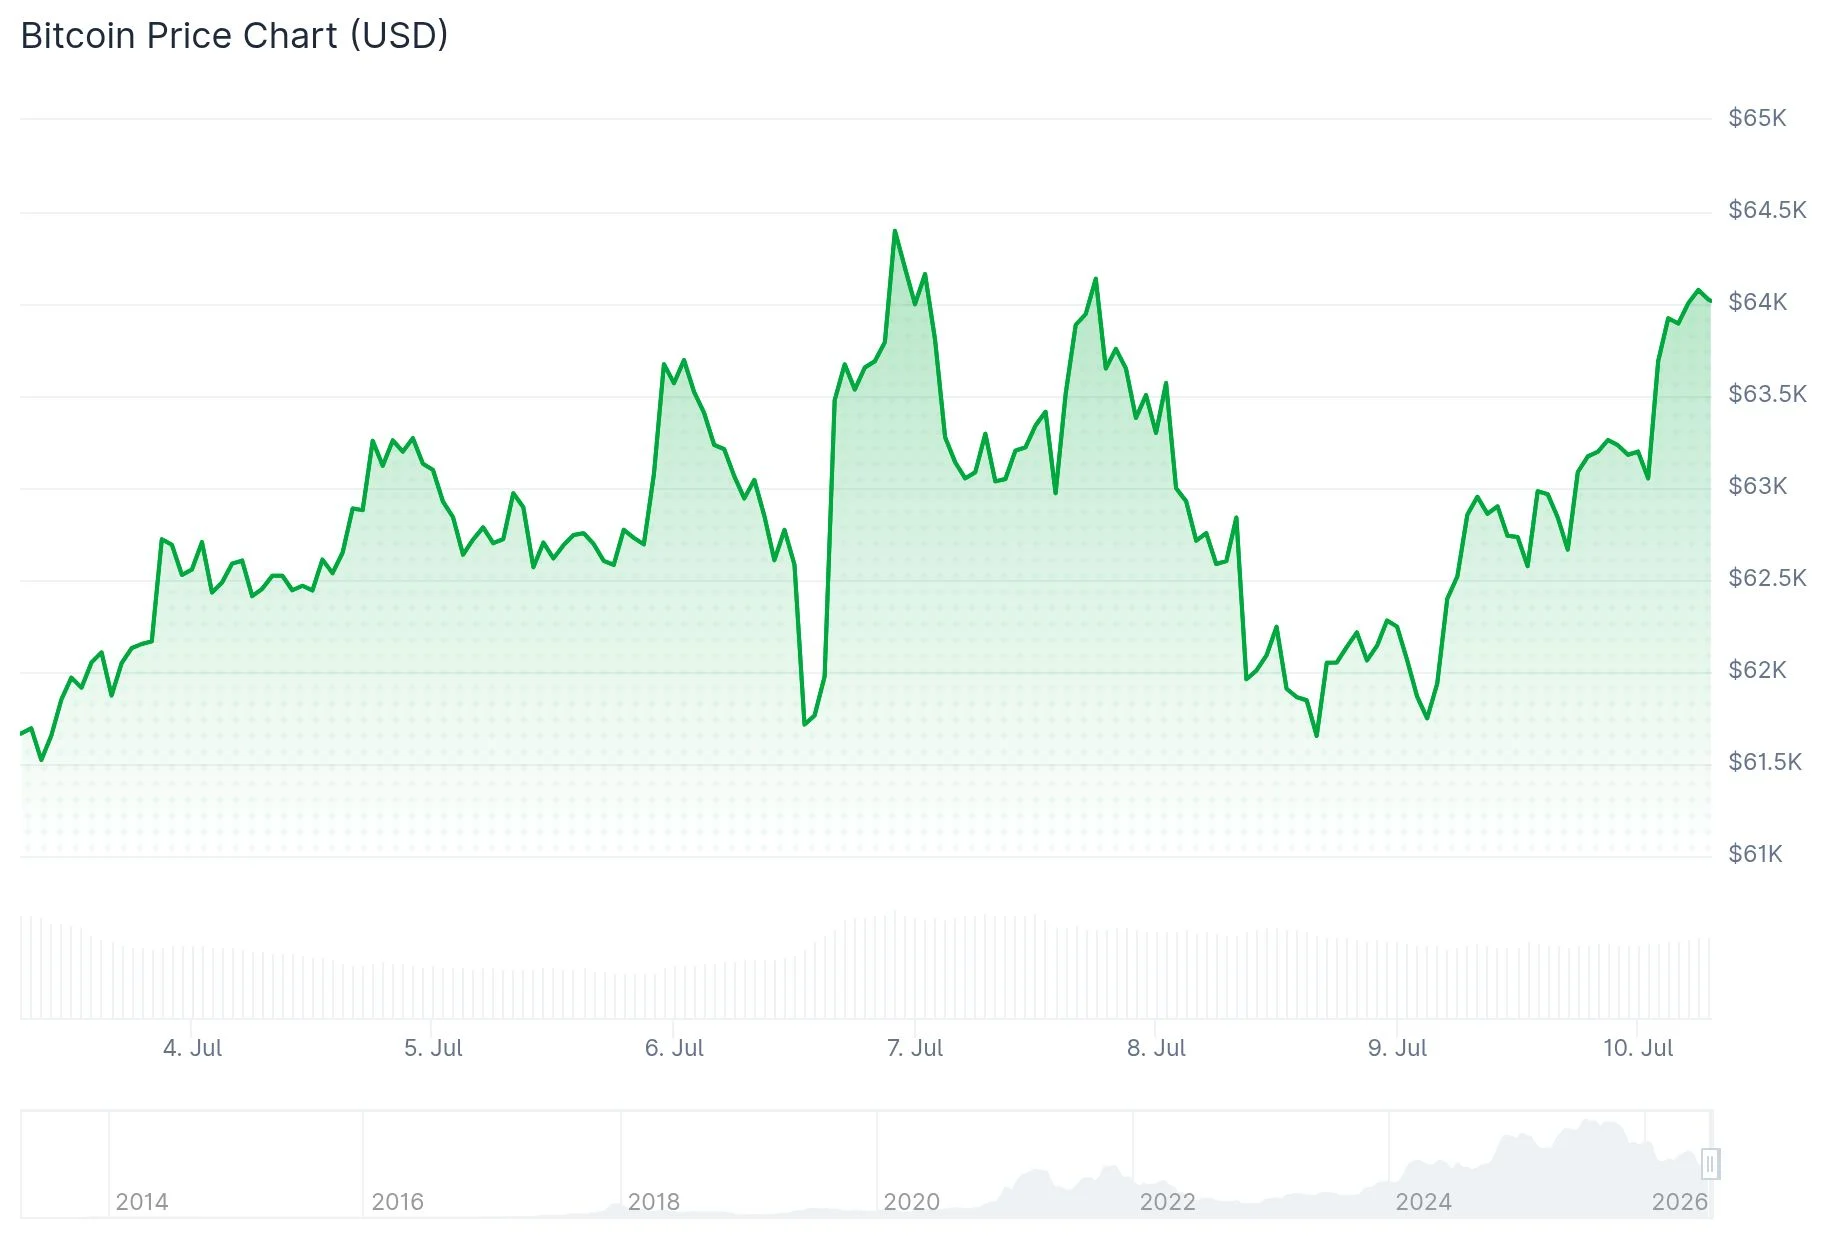
Bitcoin Surges Past $64K as Tech Stocks and Crypto Markets Rally Together


HOT
Currently trending cryptocurrencies that are gaining significant market attention
Crypto Prices
The cryptocurrencies with the highest trading volume
Newly Added
Recently listed cryptocurrencies that are available for trading